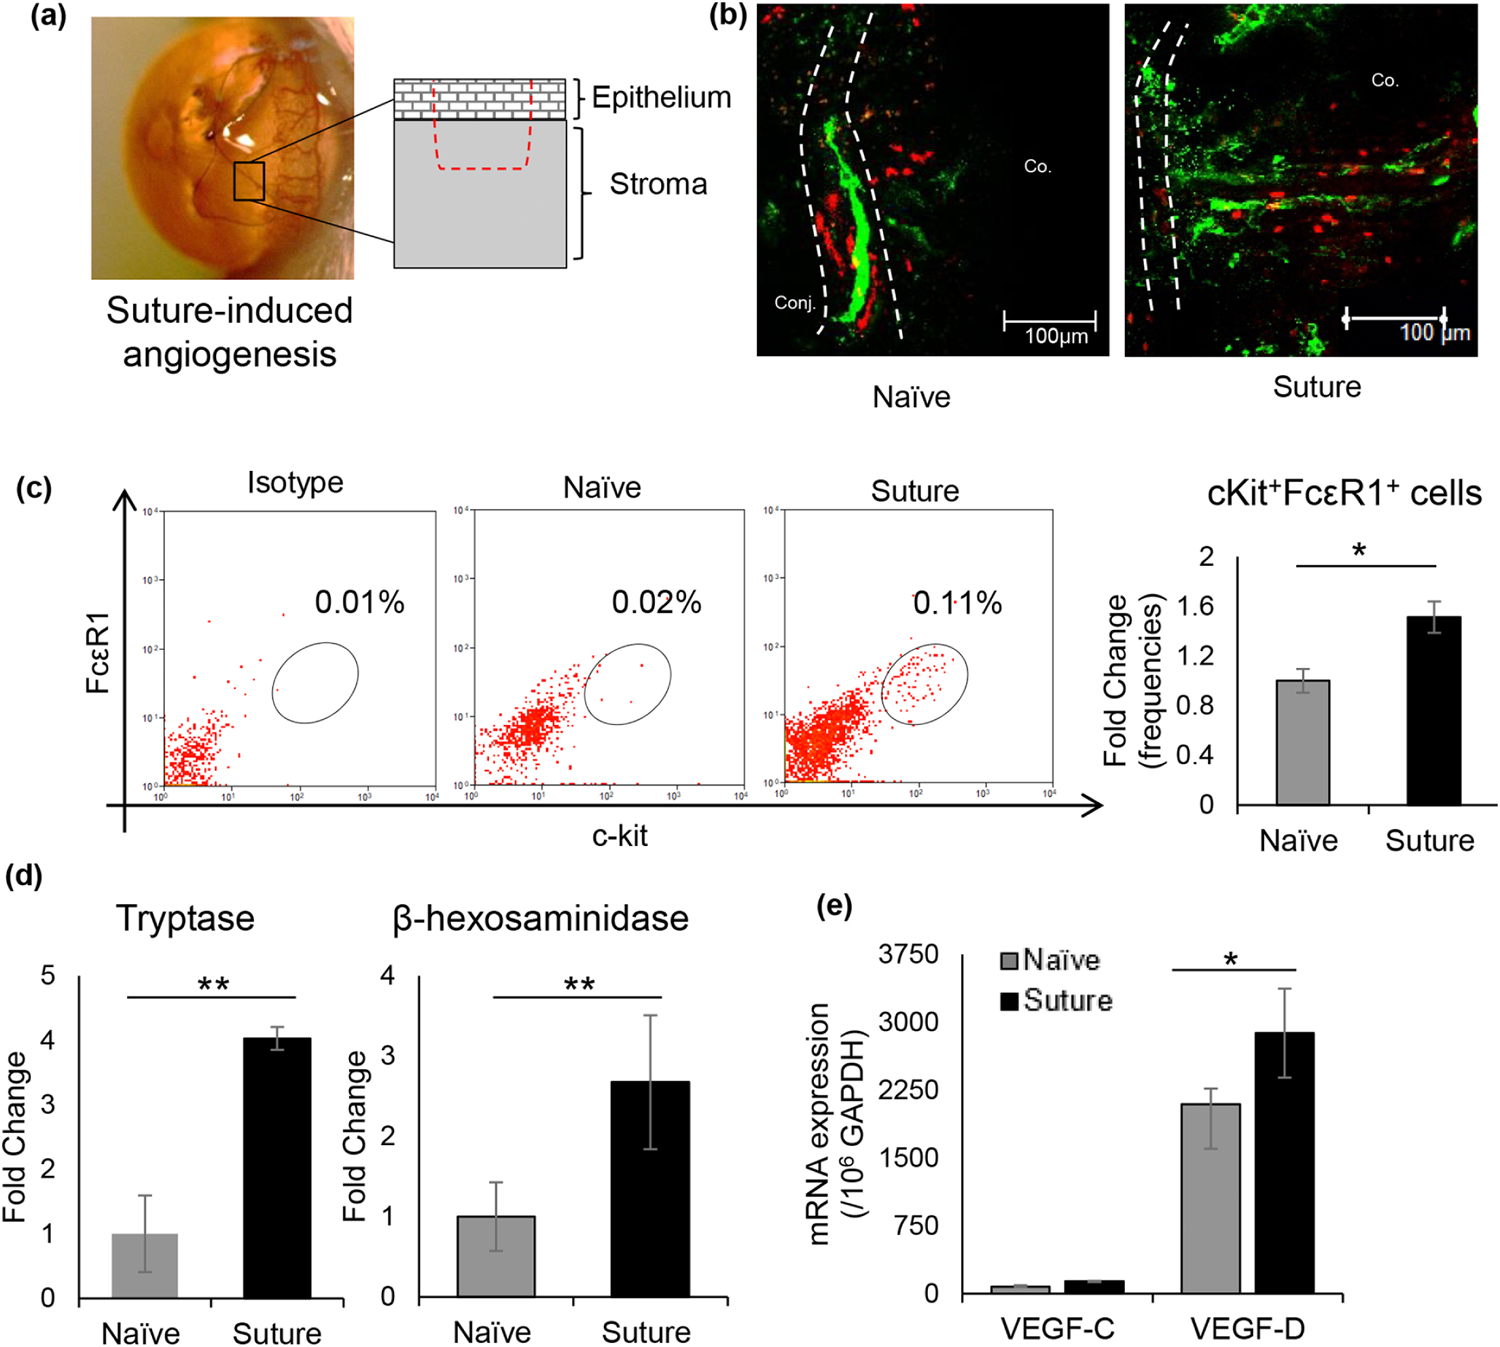
Fig. 1. Inflammatory model of corneal lymphangiogenesis and activation of mast cells.

(a) Schematic drawing of the inflammatory model of corneal angiogenesis illustrating the depth of the intrastromal suture placed 1.0 mm from the limbal vessel. (b) Representative immunohistochemistry micrographs of mast cells infiltration (Avidin – Texas red) and lymph vessel growth (LYVE-1 – AlexaFluor488) into the cornea on day 7 post-intrastromal suture placement (Scale bar, 100 μm). (c) Representative flow cytometric dot plots (left) and cumulative bar chart (right) showing frequencies of cKit+FcεR1+ mast cells (gated on CD45+ cells; fold change relative to naïve controls) at the ocular surface following suture placement. Corneas were harvested 6 hours following suture placement, and single-cell suspensions were prepared for analysis. (d) Bar chart showing fold change in levels of mast cell activation markers tryptase (left) and β-hexosaminidase (right) in ocular surface tear wash collected at 0h, 1h, 3h, and 6h following suture placement (5 μl/wash). (e) Bar chart depicting expression of VEGF-C and VEGF-D in the cornea 6 hours post-suture placement compared to naive corneas, as quantified by real-time PCR. Representative data from three independent experiments are shown, and each experiment consisted of 4 animals per group. Co., Cornea; Conj., Conjunctiva. Data are represented as mean ± SD (error bar). t-test; *p<0.05, **p < 0.01.
