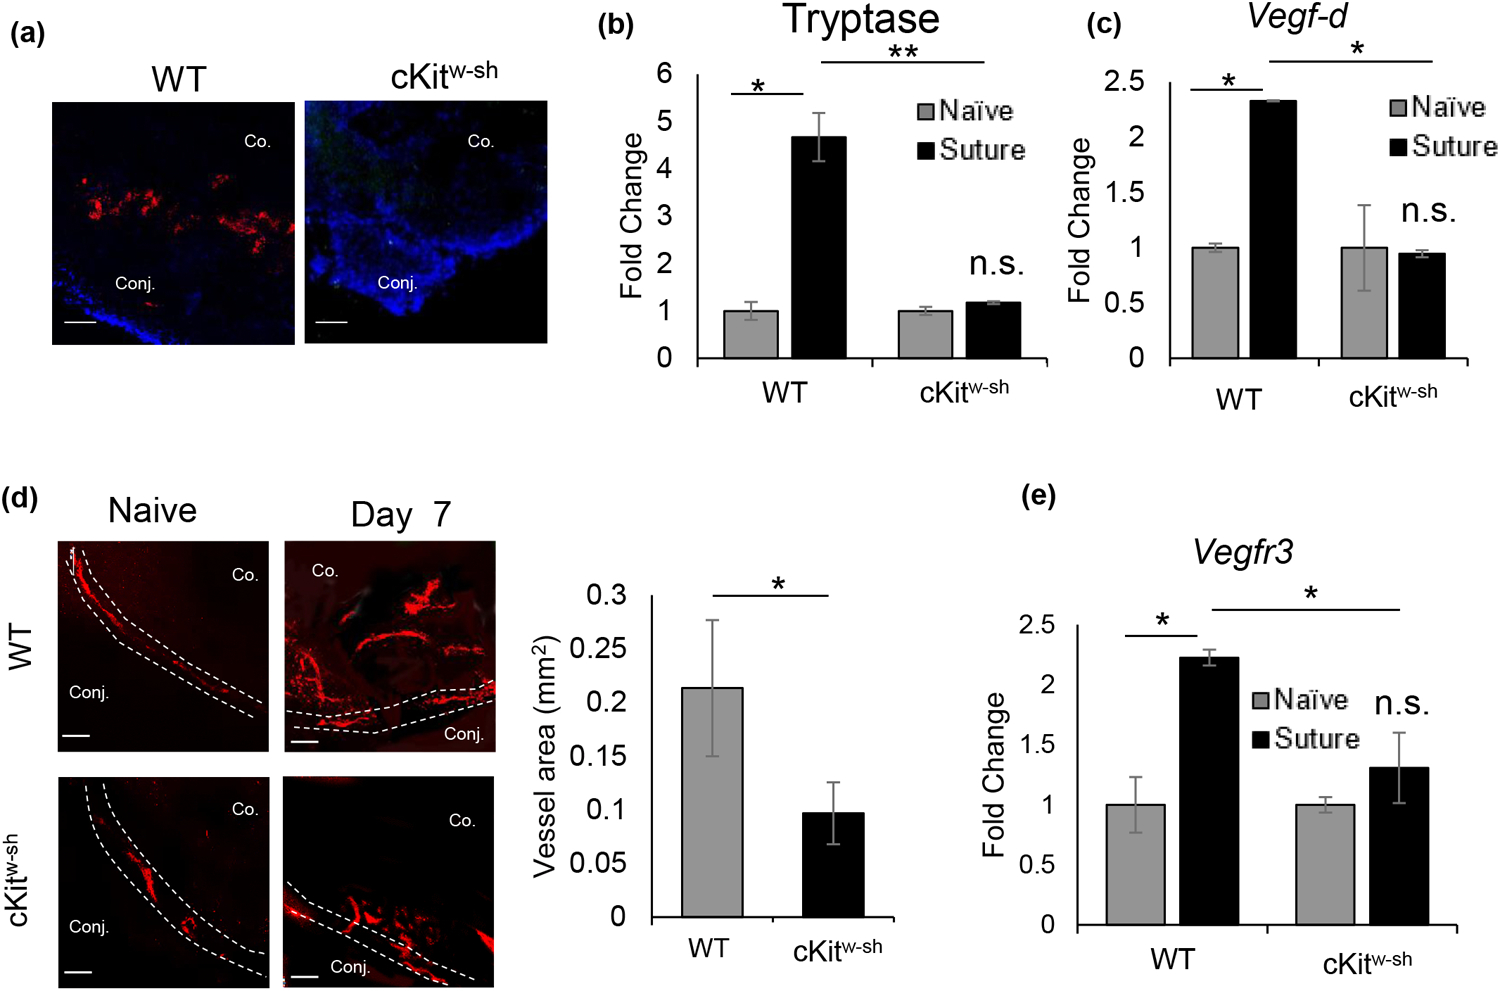
Fig. 3. Reduced lymphangiogenesis following suture placement in cKitw-sh/w-sh mice.

(a) Representative immunohistochemistry micrographs of mast cell expression (avidin-Texas red) at the ocular surface of wild type (C57BL/6) and cKitw-sh mice. (b) Bar chart showing levels of mast cell activation marker tryptase (fold change) at ocular surface tear wash collected at 0h, 1h, 3h, and 6h following suture placement (5 μl/wash) in wild-type and cKitw-sh mice. (c) Bar chart depicting expression of VEGF-D, relative to naïve state, in the cornea harvested on day 7 post-suture placement in wild type and cKitw-sh mice, as quantified by real-time PCR. (d) Representative immunohistochemistry micrographs (left) of naïve corneas and corneas harvested on day 7 post-suture placement and immunostained with LYVE-1 (Rhodamine) (left; Scale bar, 100 μm). Cumulative bar chart (right) showing lymph vessel area in corneas of wild-type and cKitw-sh mice, as quantified using ImageJ 1.52s software. (e) Bar chart showing VEGFR3 expression, relative to its naïve baseline, in corneas harvested on day 7 post-suture placement in wild type and cKitw-sh mice. Representative data from two independent experiments are shown, and each experiment consisted of n = 3 animals/group. Data are represented as mean ± SD (error bar). t-test; *p < 0.05, n.s.; not significant. Co., Cornea; Conj., Conjunctiva.
