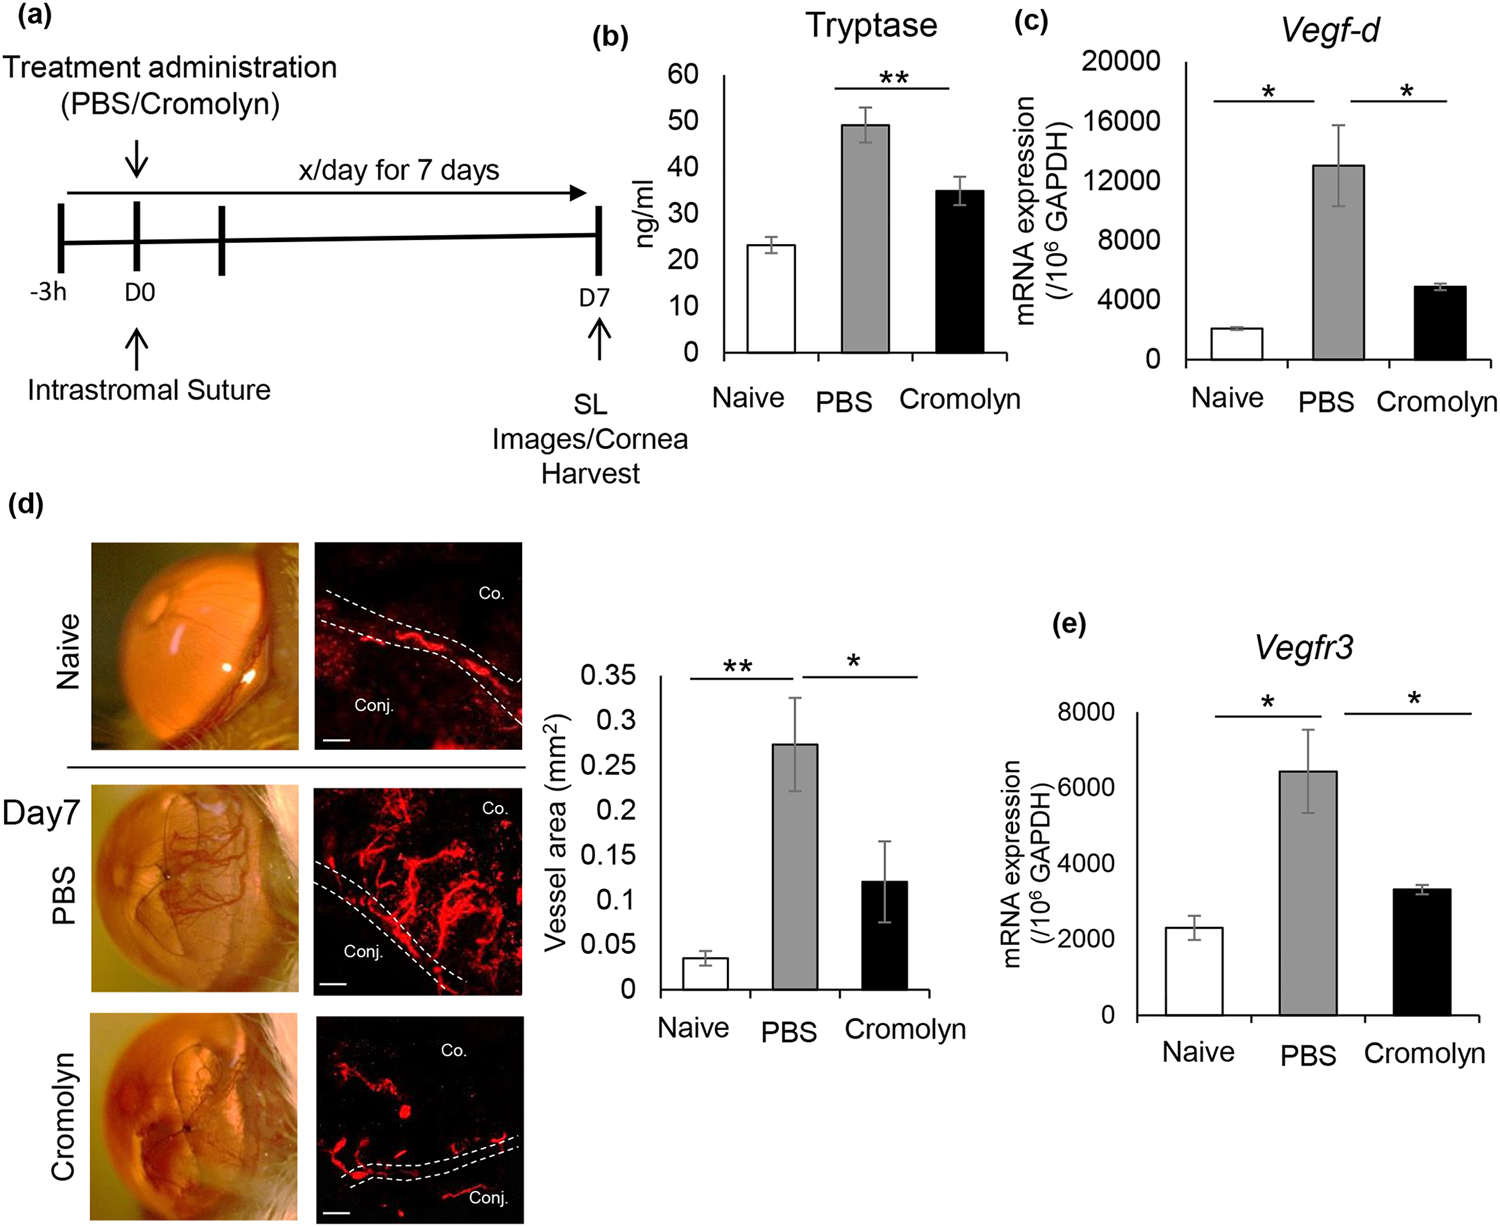
Fig. 4. In vivo blockade of mast cell activation suppresses inflammatory corneal lymphangiogenesis.

(a) Schematic experimental design showing the time points of topical treatment administration of PBS or 2% cromolyn (3 μl/treatment) to Balb/c mice. Topical treatment was administered 3 h prior to suture placement and subsequently treated 6 times a day for 7 days. Corneas were harvested for immunohistochemistry and mRNA analysis on day 7 post-suture placement. (b) Bar chart showing levels of mast cell activation marker tryptase in ocular surface tear wash collected at 0h, 1h, 3h, and 6h following suture placement (5μl/wash) in PBS and cromolyn treated corneas. (c) Bar chart showing expression levels of VEGF-D in PBS and cromolyn treated-corneas harvested on day 7 post-suture placement, compared to naive controls, as quantified by real-time PCR. (d) Corneas were harvested on day 7 when blood vessels reached the suture, as demonstrated by the slit-lamp micrographs (left). Representative immunohistochemistry micrographs of PBS and cromolyn-treated corneas immunostained with LYVE-1 (Rhodamine), compared to the naïve cornea (Scale bar, 100 μm). Cumulative bar chart (right) showing lymph vessel area in PBS and cromolyn-treated corneas, compared to naïve controls, as quantified using ImageJ 1.52s software. (e) Bar chart depicting expression of VEGFR3 in PBS and cromolyn-treated corneas harvested on day 7 post-suture placement, compared to naïve controls. Representative data from three independent experiments are shown, and each experiment consisted of n = 4 animals/group. Data are represented as mean ± SD (error bar). t-test; *p < 0.05, **p < 0.01. Co., Cornea; Conj., Conjunctiva.
