
Figure 6c.
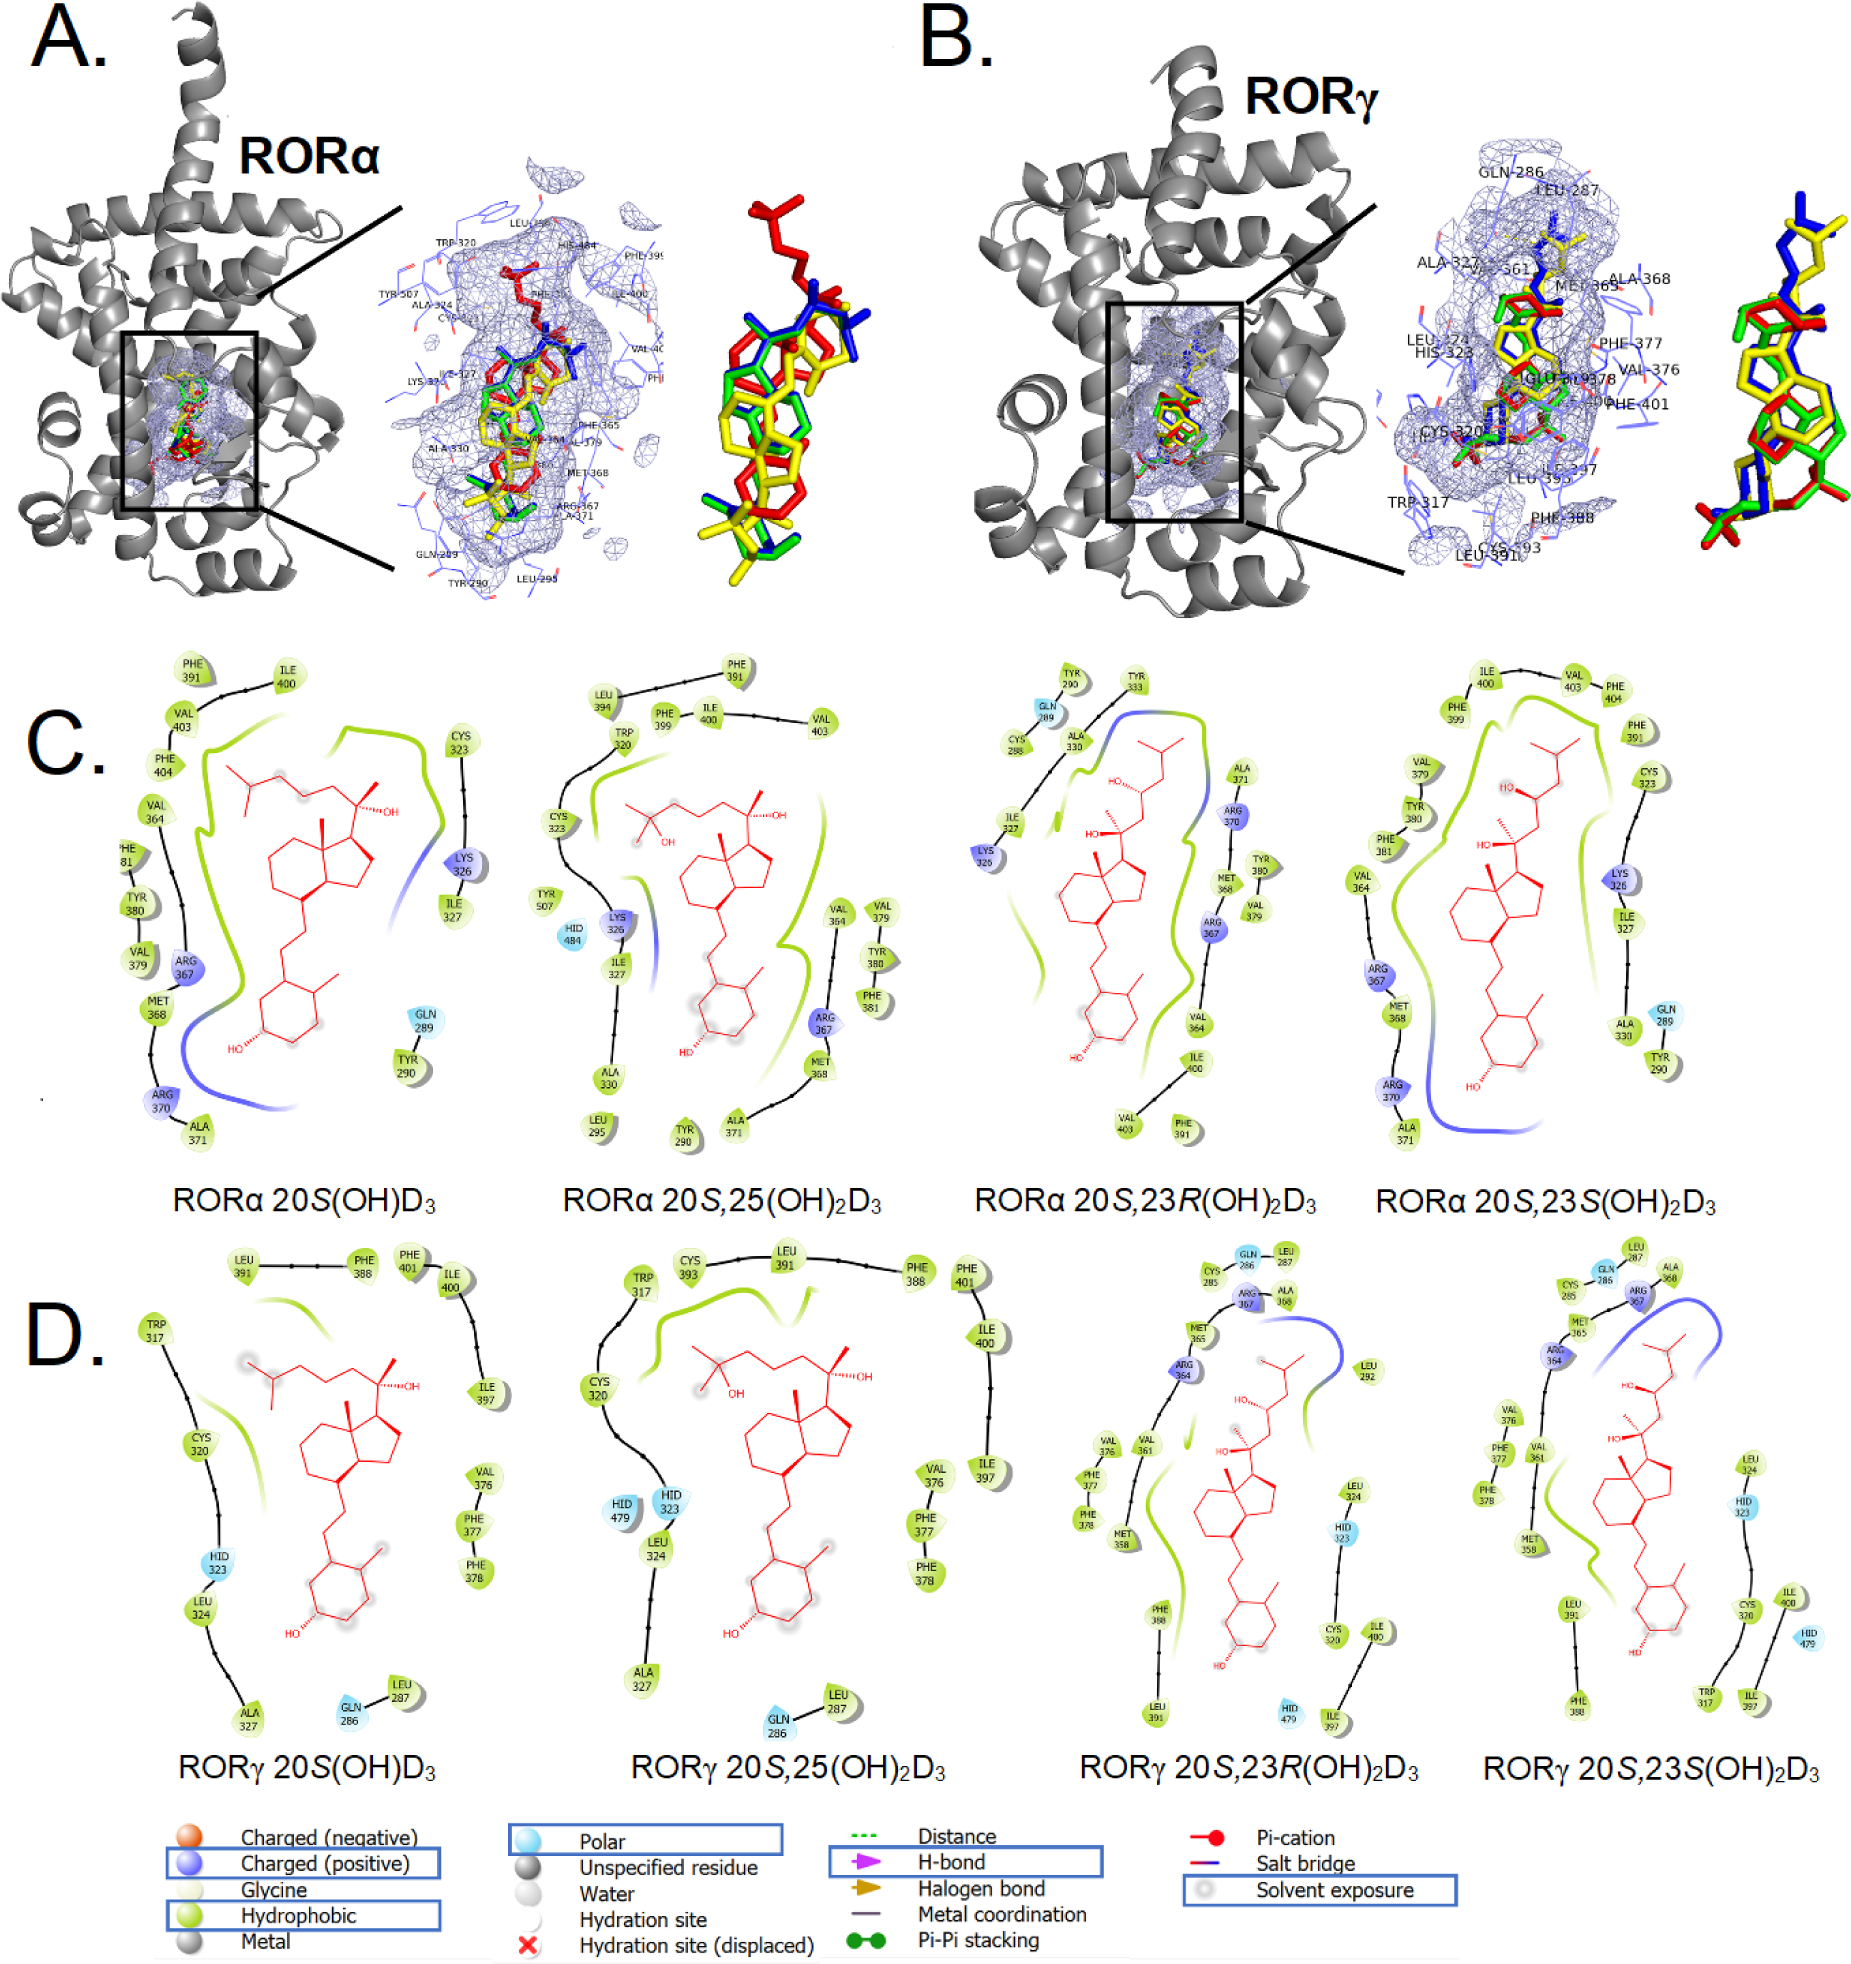
The binding pattern of selected vitamin D3 derivatives with RORs. A: 3D binding modes for 20S(OH)D3 (green), 20S,25(OH)2D3 (red), 20S,23S(OH)2D3 (blue) and 20S,23R(OH)2D3 (yellow) in ligand binding domain of RORα (cartoon in gray). B: 3D binding modes for 20S(OH)D3 (green), 20S,25(OH)2D3 (red), 20S,23S(OH)2D3 (blue) and 20S,23R(OH)2D3 (yellow) in ligand binding domain of RORγ (cartoon in gray) including a zoomed view. The binding pocket is shown as a light blue meshing area. C: 2D interaction map of 20S(OH)D3, 20S,25(OH)2D3, 20S,23S(OH)2D3 and 20S,23R(OH)2D3 with RORα. D: 2D interaction map of 20S(OH)D3, 20S,25(OH)2D3, 20S,23S(OH)2D3 and 20S,23R(OH)2D3 with RORγ (image generated with Maestro (v12.4)).