Figure 7.

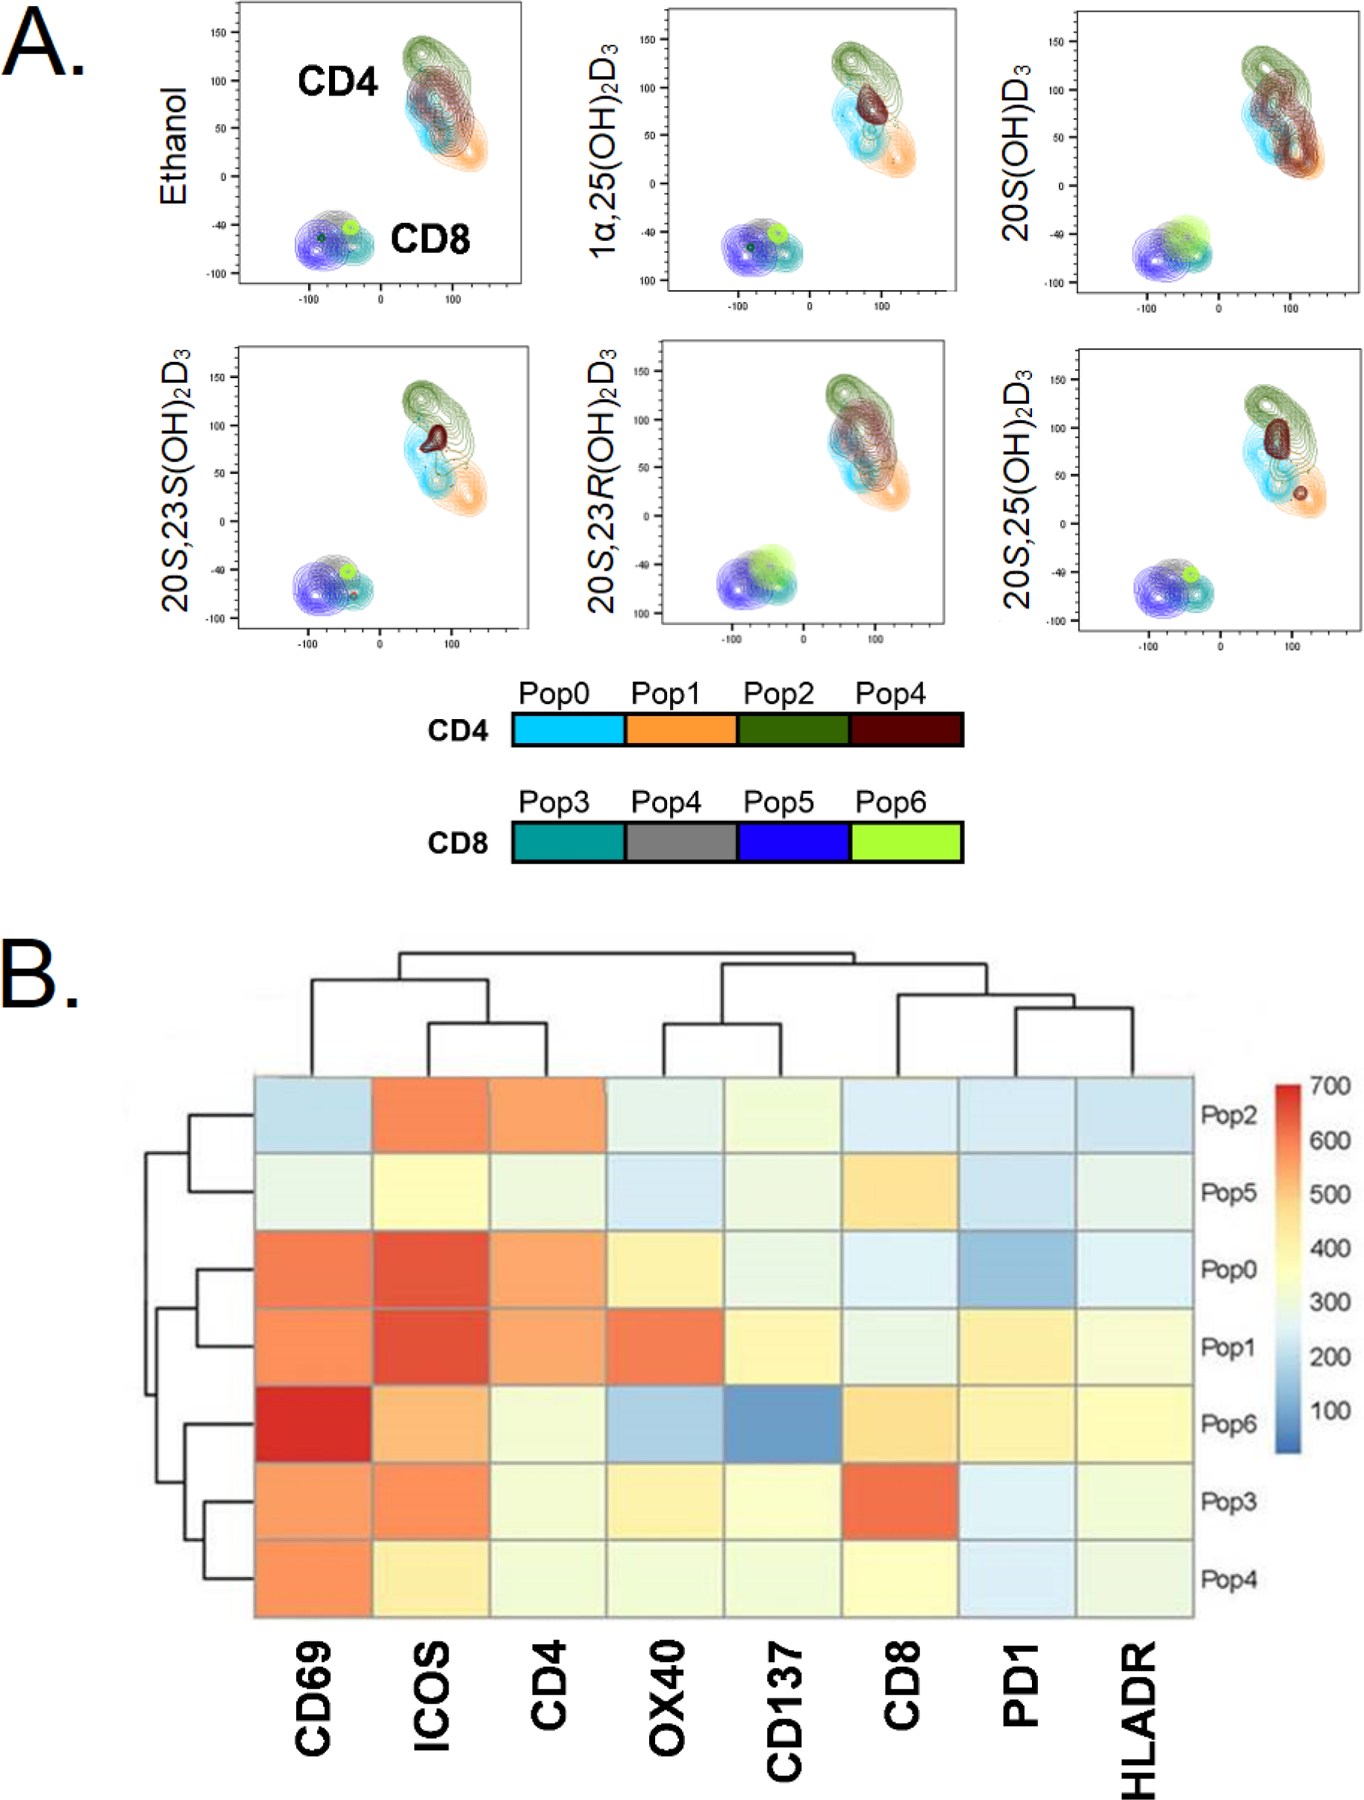
Differential and overlapping effects of secosteroids on activation of CD4 and CD8 T cells from human peripheral blood. A: FlowSOM analysis shows that the different vitamin D3 secosteroids variably alter CD4 and CD8 T cell activation. B: Heat map of FlowSOM clusters representing the level of expression of activation induced markers (AIM) on CD4 and CD8 T cell population shown in A. T cells in peripheral blood from two healthy individuals were activated with anti-CD3 and anti-CD28 in the absence (ethanol) or presence of 10−7 M of each of the vitamin D3 secosteroids for 24 h. The cells were stained for lineage markers (CD4, CD8, CD19, CD14) and a panel of activation induced markers (CD69, ICOS, OX40, CD137, PD1, HLADR) and expression data were collected using a flow cytometer. The gating strategy was live, single cell followed by CD4 and CD8 T cell populations. The data file output following following CD4 and CD8 T cell gating from each individual were concatenated into one file and subjected first to the dimensionality reduction algorithm TriMAP, which clusters cell populations based on relatedness using three points. The data shows that CD4 and CD8 T cell populations cluster independently as expected. Following TriMAP analysis, we performed clustering with Self-Organizing Maps (FlowSOM) and the identified clusters were overlayed on to TriMAP clusters. Pop0 to Pop6 are subpopulations of cells based on expression levels of all markers shown in the heat map (Fig. 6B). Unbiased analyses using TriMap dimensionality reduction clustering followed by FlowSOM “R” algorithm-based clustering defined these subpopulations based on the expression levels of the markers. The algorithm-based clustering analysis takes into consideration the expression levels CD4, CD8 and all AIMs. The expression levels for each marker in specific FlowSOM populations is output as a heat map B. The heat map reflects the levels of expression of each marker within each subpopulation (Pop0 – Pop6) and is not by itself reflective of response to a vitamin D3 analogue.
