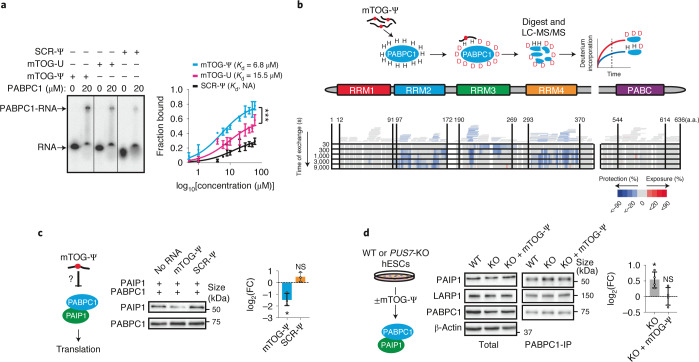
Fig. 1. Molecular characterization of mTOG-Ψ PABPC1 binding reveals impairments in PAIP1 translation enhancer recruitment.
a, Electrophoretic mobility shift assay showing direct interaction between mTOG-Ψ and PABPC1 (left). Unmodified mTOG (mTOG-U) and SCR-Ψ oligos are shown for comparison. Michaelis–Menten binding curve showing increased PABPC1 affinity for mTOG-Ψ (right). The fraction of RNA bound to PABPC1 is shown at increasing PABPC1 concentration. Data are the mean ± s.d. Kd, dissociation constant; NA, not applicable. ***P = 0.0006, nonlinear regression; n = 3 biologically independent experiments. b, Schematic of the HDX-MS approach to delineate the molecular interactions between mTOG-Ψ and PABPC1 (top). The heat map shows difference in maximum deuterium (D) uptake ± mTOG-Ψ at different time points (bottom). Regions of PABPC1 protected or exposed from solvent exchange in the presence of mTOG-Ψ are shown in blue and red, respectively. Peptide coverage for PABPC1 is illustrated by bars above the heat map and is colour-coded based on the average deuterium uptake across all time points. Numbers correspond to the amino acid (a.a.) residues in PABPC1. LC-MS/MS, liquid chromatography with tandem mass spectrometry. c, The PAIP1–PABPC1 interaction is inhibited by mTOG-Ψ. Recombinant PABPC1 and PAIP1 were incubated in the presence or absence of mTOG-Ψ (left). The fraction of PAIP1 that co-precipitated with PABPC1 was determined by western blotting (middle) and quantified (right) as the log2-transformed FC of the PAIP1 fraction co-precipitated with PABPC1 (mean ± s.d.) in mTOG-Ψ or SCR-Ψ conditions normalized to control samples without RNA. *P = 0.0415; and NS, not significant; two-tailed Welch’s t-test; n = 3 biologically independent experiments. d, PAIP1 recruitment to PABPC1 in hESCs is impaired by mTOG-Ψ. Endogenous PABPC1 was immunoprecipitated in WT and PUS7-KO hESCs ± mTOG-Ψ (middle; schematic of the experiment on the left). LARP1 was used as a control. The level PAIP1 co-immunoprecipitation (mean ± s.d.), normalized to the WT, was determined (right). *P = 0.0286; and NS, not significant; two-tailed Mann–Whitney U test; n = 4 biologically independent experiments.

