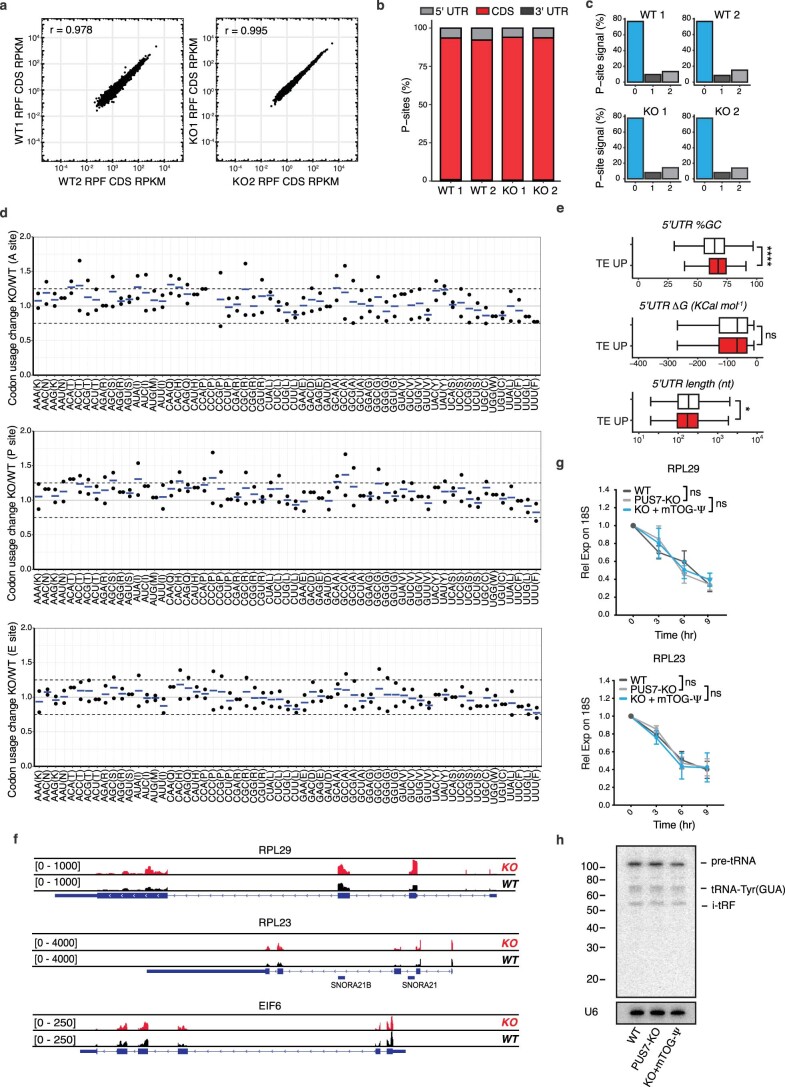
Extended Data Fig. 2. Ribosome profiling reveals translational regulation of 5’PES-containing mRNAs.
a, Plots show reproducibility of ribosome profiling RPF libraries from WT and PUS7-KO hESCs. r, Pearson correlation coefficient. b-c, Percentage of P-sites in coding sequence (CDS) or untranslated regions (UTR) (b) and assigned to reading frames 0, 1 and 2 (c) are shown. d, Analysis of ribosome occupancy at individual codons for the A-, P- and E-site is shown as the ratio PUS7-KO/WT. Data are shown as values and mean of two independent experiments. e, 5’UTR analysis of translationally upregulated mRNAs in PUS7-KO hESCs shows increased GC percentage and decreased length compared to the transcriptome. Boxplots show the upper and lower whiskers (box boundaries), the upper and lower quartiles, and the median. ****p=1.63e−25; *p=0.01; ns, no statistical significance (two-sided Wilcoxon signed-rank test). TE UP n=2023 and, transcriptome n=16063. f, Genome browser tracks show representative reads from ribosome-protected fragments in WT and PUS7-KO for RPL29, RPL23 and EIF6 mRNAs. g, mTOG-Ψ do not affect RPL29 and RPL23 mRNA stability. Transcript levels were measured at indicated time points after Actinomycin-D treatment and normalized to the 18S rRNA. n=3 independent biological replicates at each time point, presented as mean±SD. h, tRNA-Tyr (GUA) northern blot analysis in hESCs PUS7-KO ± mTOG-Ψ U6 RNA is included as loading control, n=3 independent experiments.

