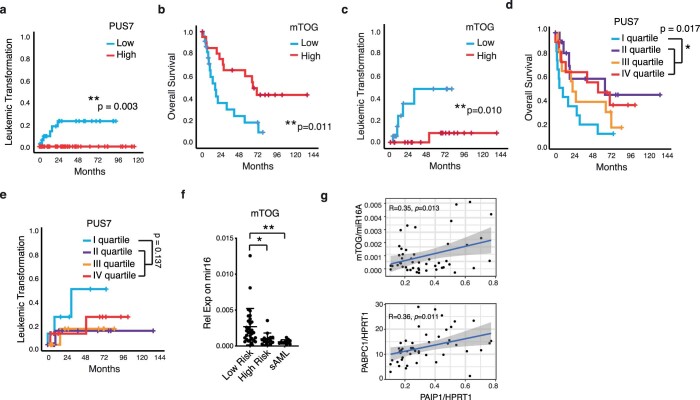
Extended Data Fig. 4. Clinical assessment of PUS7 and mTOG dysregulation in MDS.
a, Increased risk of AML progression in MDS patients with low PUS7 expression (HR=102, n=100) evaluated in HSPC from a previously published study29. b, Decreased overall patient survival (n=44, HR=3.1, 95% CI, 1.4-6.9) and c, increased risk of AML progression (n=38, HR=10.1, 95% CI, 1.2-88) in patients with reduced HSPC mTOG expression. Patients with −7/del(7q) were excluded from the analysis. p-values were calculated using log-rank test. d-e, PUS7 levels in primary MDS-HSPC. Low PUS7 mRNA expression (I quartile) is associated with decreased overall survival (HR = 2.4, 95% CI 1.14–5.04, n=50). p-values were calculated using log-rank test. f, mTOG levels are reduced in high risk MDS and secondary AML (sAML) HSPC. mTOG levels were quantified by RT-qPCR and normalized to mir16 levels. *p =0.0205; **p=0.0082 (one-way ANOVA with multiple comparison). n=30 LR, 15 HR and 11 AML individual patient samples, presented as mean ± SD. g, Pairwise correlation between mTOG and PAIP1 or PABPC1 mRNA levels in primary MDS-HSPC (n=50). Expression of each of the RNAs was quantified by ddPCR and normalized to miR16 (mTOG) or HPRT1 levels (PAIP1 and PABPC1). The shaded region in each graph represents the confidence interval.

