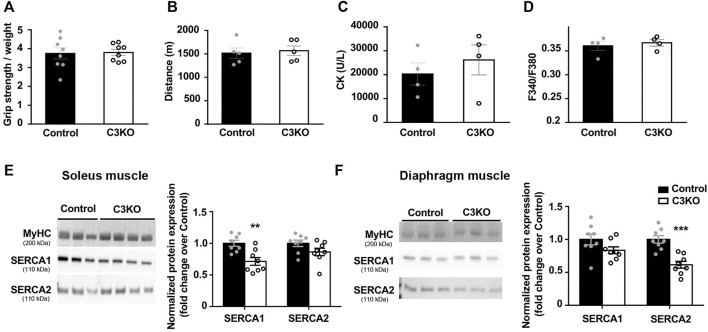
FIGURE 3.
Characterization of early features in preclinical C3KO mice. (A) Grip strength normalized to body weight. Data expressed as mean ± SEM. n = 8 2-month-old male mice for each genotype (Mann-Whitney test). (B) Distance until exhaustion during forced exercise. Data expressed as mean ± SEM, n = 5 mice per group (Mann-Whitney test). (C) Serum creatine kinase (CK) levels. Data are expressed as mean ± SEM. n= 4 mice per group (Mann-Whitney test). (D) Resting intracellular calcium levels of fibers isolated from flexor digitorum brevis muscles. Data expressed as mean ± SEM. 115-155 fibers analyzed from n = 4 mice per group (Mann-Whitney test). (E,F) Western blot analyses of SERCA proteins normalized to MyHC in soleus (E) and diaphragm (F) muscles. Data are expressed as mean fold change ± SEM of n = 8 mice per genotype.**p < 0.01, ***p < 0.001 vs. control (Mann-Whitney test). Dots in the bar charts represent data from one mouse.

