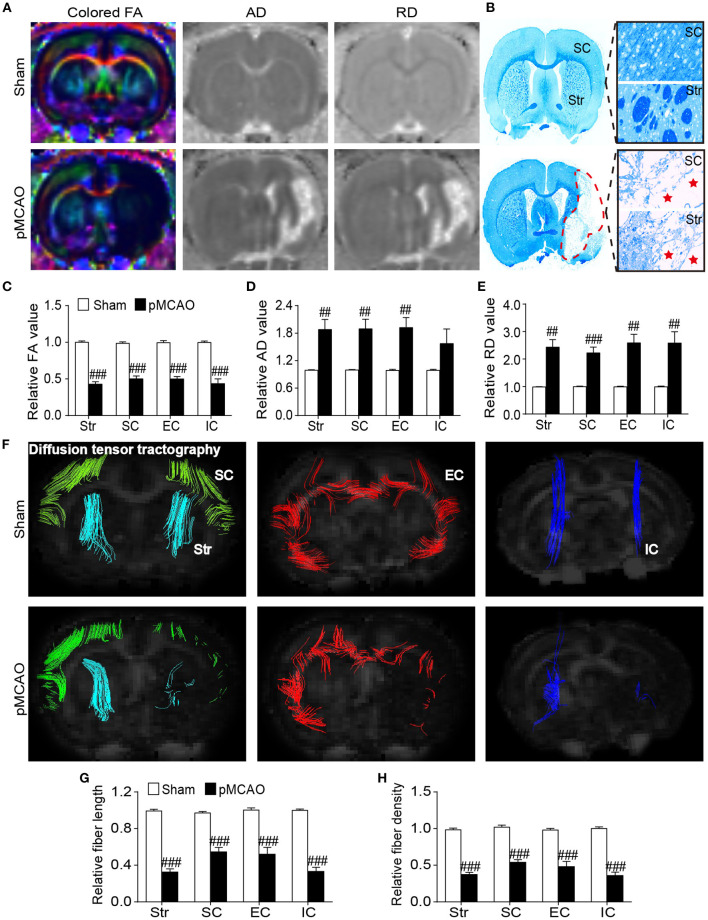
Figure 5.
pMCAO induced microstructural damages of the cerebral gray and white matter in rats. (A) Representative colored FA, AD, and RD images of the sham and pMCAO rats. (B) Typical LFB staining images of the sham and pMCAO rats. (C–E) Quantitative analysis of the relative FA, AD, and RD, respectively. (F) Diffusion fiber tracking with the seed placed on the bilateral sensorimotor cortex (SC), striatum (Str), external capsule (EC), and internal capsule (IC). (G,H) Quantitative analysis of the relative fiber length and fiber density, respectively (Student's t-test, N = 8 for the sham group and N = 9 for the pMCAO group). ##P < 0.01, ###P < 0.001 vs. sham group.

