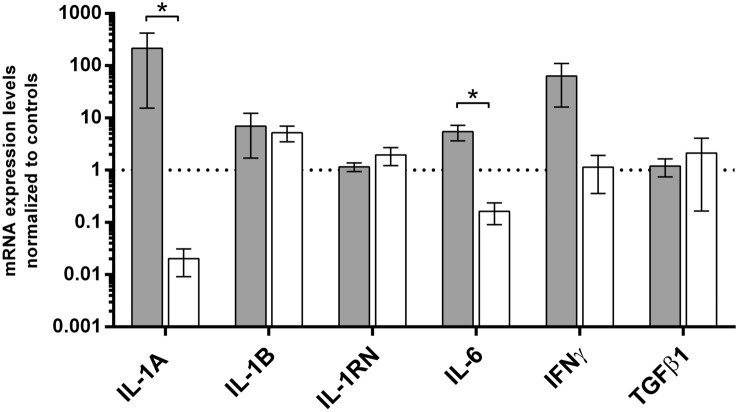
Fig. 4.
Summary of cytokines’ gene expression levels in penile lichen sclerosus to the occurrence of micro-incontinence. Gene expression was assessed as described in “Materials and methods”. The ordinate axis is shown on a logarithmic scale. Bars and whiskers represent the mean ± standard deviation of the mean (SEM) normalized to control foreskin samples (dotted horizontal line at 1), grouped by each analyzed gene. Bar legends: light grey bars represent PLS patients with micro-incontinence (MI) while white ones represent PLS patients without MI, respectively. *P < 0.05, Mann–Whitney U test between MI and lack of MI subgroups

