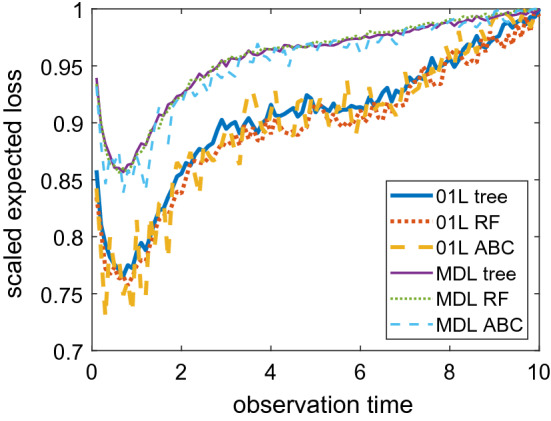
Fig. 1.

Plots of the approximated expected loss functions produced by the tree classification approach with cross-validation (solid), the random forest classification approach using out-of-bag class predictions (dotted), and the ABC approach (dashed) under the 0–1 loss (thick lines) and multinomial deviance loss (thin lines) for the infectious disease example. The expected losses have been scaled by dividing through the maximum loss for an easier comparison
