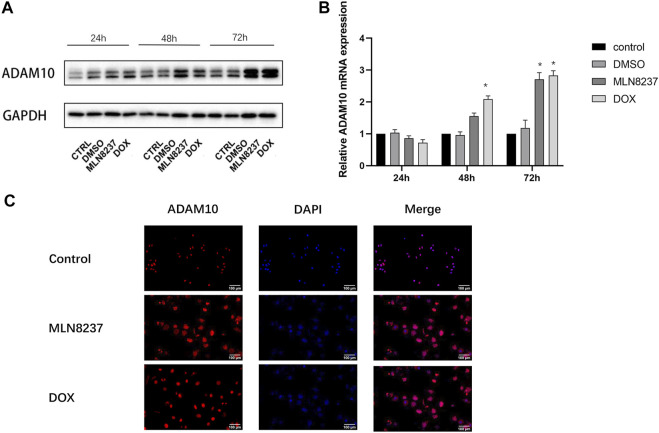
FIGURE 3.
ADAM10 expression is upregulated in senescent cells. (A) IMR-32 cells were treated with 2 μM MLN8237, 0.5 μM DOX, DMSO, or no treatment as a control. Cell samples were collected at 24, 48, and 72 h. (B) Western blot and qRT-PCR analyses of ADAM10. (C) IMR-32 cells were treated with 2 μM MLN8237 or 0.5 μM DOX for 72 h, with no treatment was used as a control. Immunofluorescence detection of ADAM10 expression (magnification: ×20). Data represent the mean ± SEM of three independent experiments. *p < 0.05.

