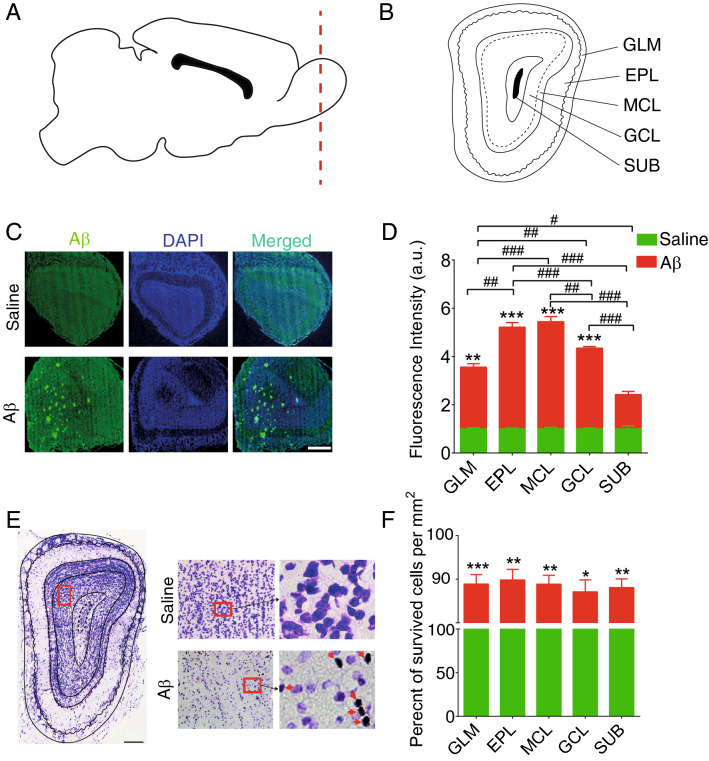
Figure 3.
Survived cells in the OB. (A and B) Schematic representation of OB subregions. (C) a sample of immunostaining sections from OB of animals that received i.c.v. saline and Aβ. (D) Immunostaining of anti-Aβ1-42 indicated a high level of plaque accumulation in Aβ animals compared to the saline group. (E) Representative of OB section stained by Nissl method to evaluate the survived cells in OB subregions. (F) Aβ animals demonstrate significantly lower survival cells in this region compared to the saline group. Red arrows show dense bodies of dead cells. Aβ amyloid-beta, OB olfactory bulb, GCL granule cell layer, GLM glomerular layer, EPL external plexiform layer, MCL mitral cell layer, SUB subependymal layer, *p < 0.05, **p < 0.01, ***p < 0.001 compared to saline. #p < 0.05, ##p < 0.01, ###p < 0.001 comparision among OB subregions in Aβ group.

