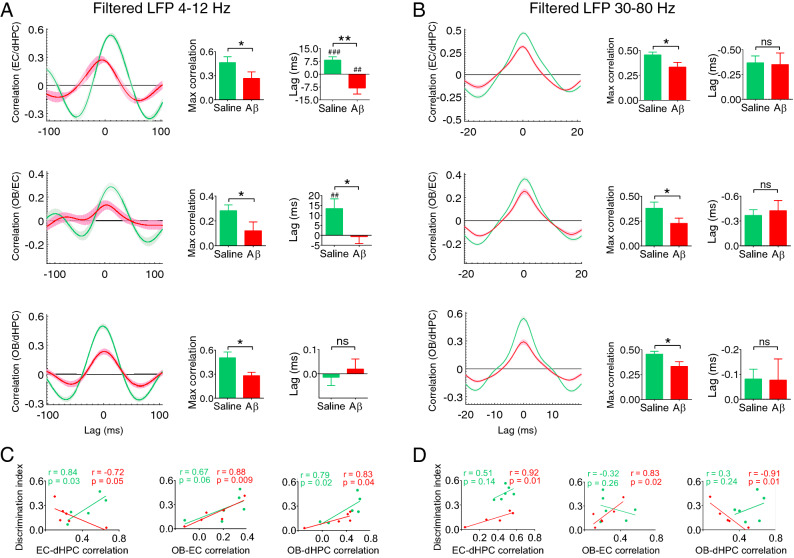
Figure 6.
Aβ disrupts synchrony in the OB-EC-dHPC circuit during recognition memory performance. (A and B) Mean correlation in time lag at theta and gamma bands, respectively. The network correlation in Aβ animals decreased at both theta and gamma ranges compared to the saline group. A reduction was found at the theta band for information influx lag from OB to EC and EC to dHPC in Aβ animals. Moreover, Aβ animals showed an inverted direction of information influx from OB to EC and EC to dHPC at theta band. (C and D) Correlation between task performance and synchrony at theta and gamma bands, respectively. A correlation was found between NOR performance and synchrony in the OB-EC-dHPC circuit at theta and gamma bands. At theta band, NOR performance was positively correlated with OB-dHPC and OB-EC synchrony for both groups. Also, in the EC-dHPC circuit, this correlation was negative and positive for Aβ animals and the saline group, respectively. At the gamma band, the correlation was negative between NOR performance and circuits for Aβ animals. Lines display the mean of correlation coefficient across the lag, and the shaded area represents SEM. Bar graphs are generated by an average of maximum coefficient and lag values for cross-correlation. Comparisons were conducted by t-test and Pearson correlation coefficients. n = 6 per group. For Pearson correlation, data were assessed regarding outliers. *p < 0.05, **p < 0.01; ns, not significant. ##p < 0.01, ###p < 0.001 according to one-sample t-test comparison with the constant value of zero. Aβ amyloid-beta, OB olfactory bulb, EC entorhinal cortex, dHPC dorsal hippocampus, NOR novel object recognition.

