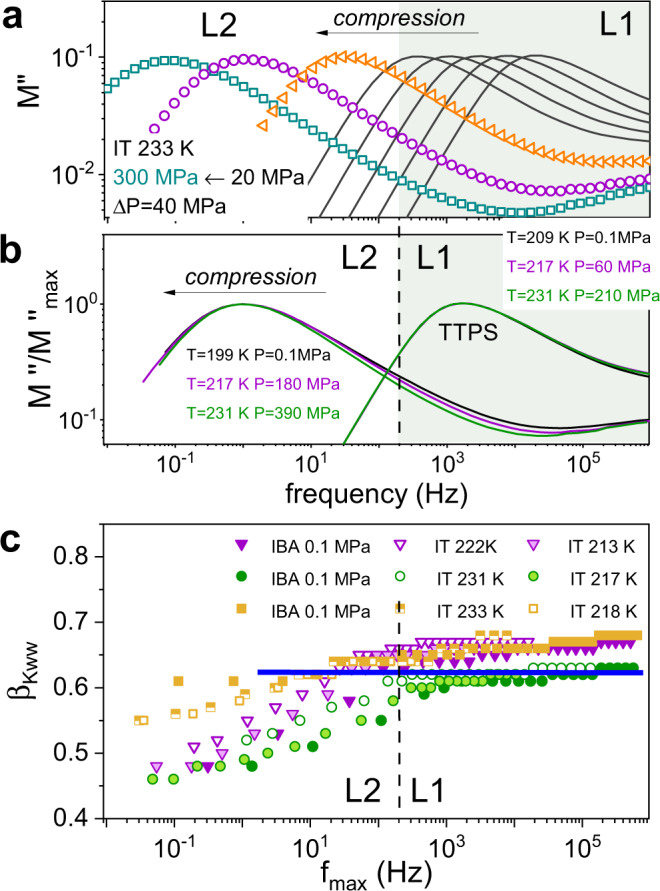
Fig. 4. Dielectric response of studied ILs measured at high-pressure conditions.

a The representative dielectric data recorded for [P666,14][TCM] in liquid 1 (solid lines) and liquid 2 (scatters) phases, recorded during compression at isothermal (IT) conditions of 233 K and presented in electric modulus representation. b The representative M″(f) spectra of [P666,14][TCM] recorded at various T-P conditions however at the same τσ superimposed to each other in liquid 1 and liquid 2, respectively. Note that time temperature pressure superposition (TTPS) rule is valid. c The βKWW exponent is plotted as a function of the frequency of modulus peak maximum at various thermodynamic conditions. IBA denotes 0.1 MPa and various temperatures, while IT denotes isotherm and various pressure. Triangles-[P666,14][TFSI], circles-[P666,14][TCM], squares-[P666,14][TAU]. The horizontal line indicates βKWW for [P666,14][BOB] being constant at various T-P conditions. The color area on a, b denotes the liquid 1 phase. L1 denotes liquid 1 while L2 liquid 2. Source data are provided as a Source Data file.
