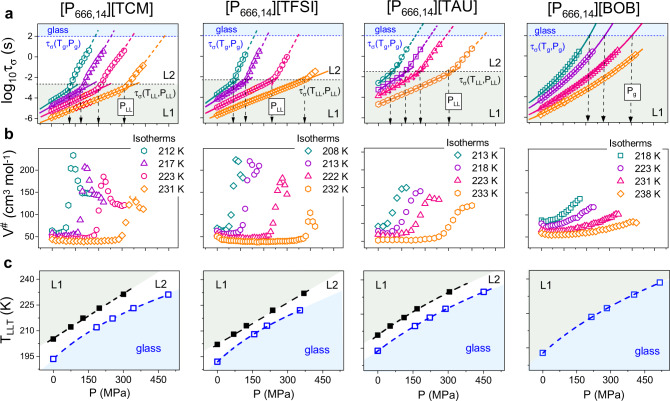
Fig. 5. High-pressure data of [P666,14][TCM], [P666,14][TFSI], [P666,14][TAU], and [P666,14][BOB] (from left to right respectively).
a Presents the pressure dependence of conductivity relaxation time measured at various T. Solid lines denote the pVFT fit to experimental data. Dashed lines indicate liquid–liquid transition pressure (PLL) and τσ at LLT. Pg denotes liquid–glass transition pressure. b Presents pressure dependence of apparent activation volume, V#. The four-time increase in V# at LLT indicates a formation of nonpolar domains of large scale in liquid 2. c TLL and Tg as a function of P is presented. The color area on a and c denotes the liquid 1 phase (gray) and glass region (blue). L1 denotes liquid 1 while L2 liquid 2. Source data are provided as a Source Data file.

