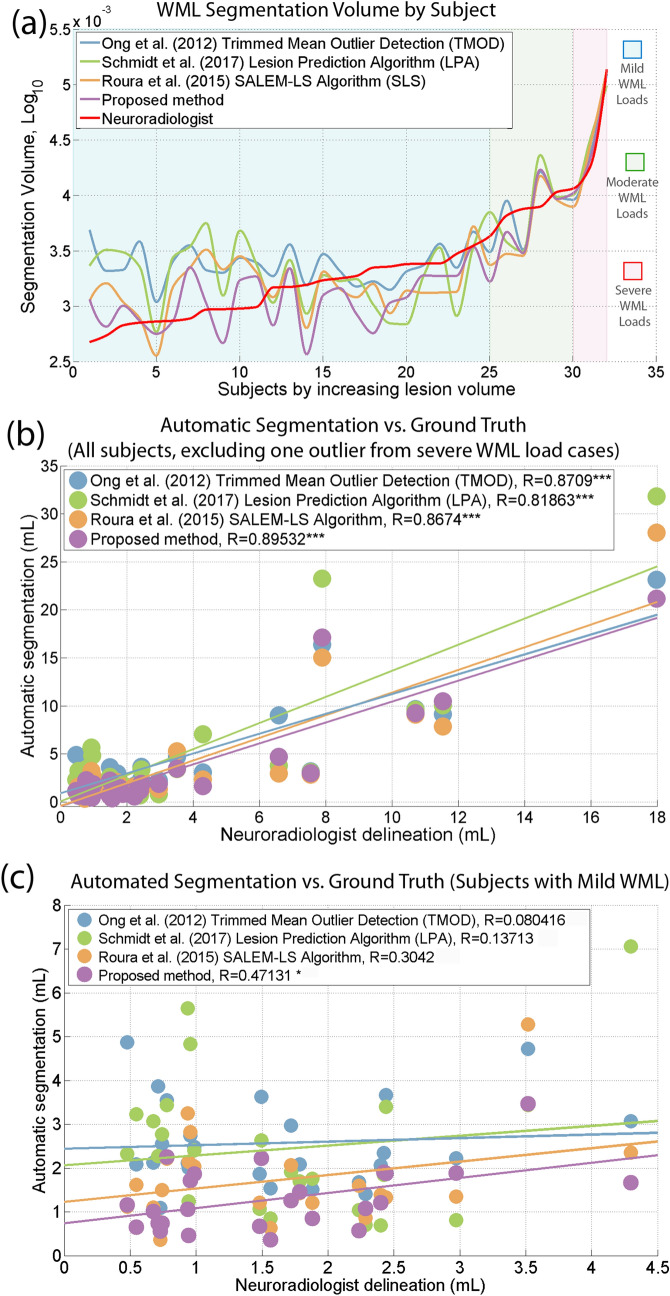
Figure 2.
Correlations between automated WML segmentations and ground truth stratified by lesion load. (a) The total WML load for each subject manually segmented by the neuroradiologist and automated methods was quantified and sorted by increasing lesion volume in the corresponding ground truth. Subjects were stratified into three WML load groups: mild (< 5 mL, blue background), moderate (5–15 mL, green background) and severe (> 15 mL, red background), also based on the ground truth lesion load. (b) A scatter plot of the simple linear regression analysis (32 subjects minus one outlier from severe WML load cases) for WML volume of each automated method compared to the ground truth. (c) A scatter plot of the simple linear regression analysis (25 subjects with < 5 mL WML load) for each automated method compared to the ground truth.

