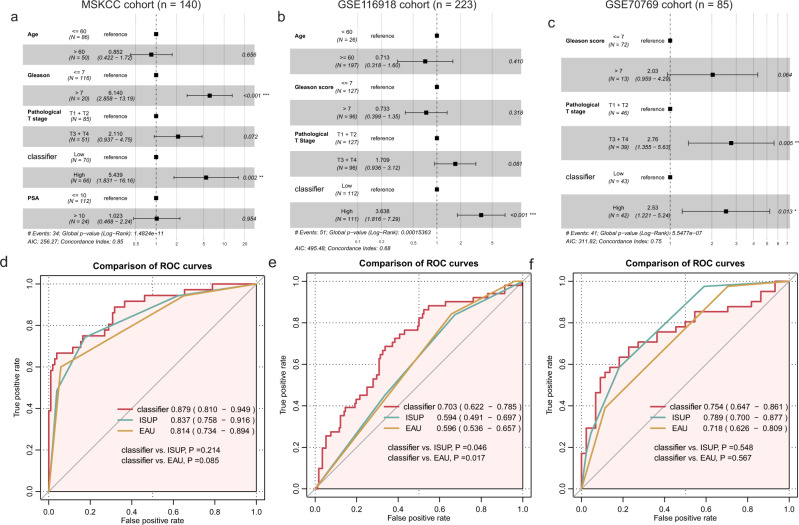
Fig. 3. Multivariate regression and combined receiver operating characteristic curve analyses.
Forest plot showing the independent prognostic value of the classifier in the MSKCC (a), GSE116918 (b), and GSE70769 (c) cohorts; Comparison of the prognostic value of clinicopathological features, classifier and the synthesized model by receive operating characteristic curve in the MSKCC (d), GSE116918 (e), and GSE70769 (f) cohorts. *P < 0.05, **P < 0.01, ***P < 0.001.

