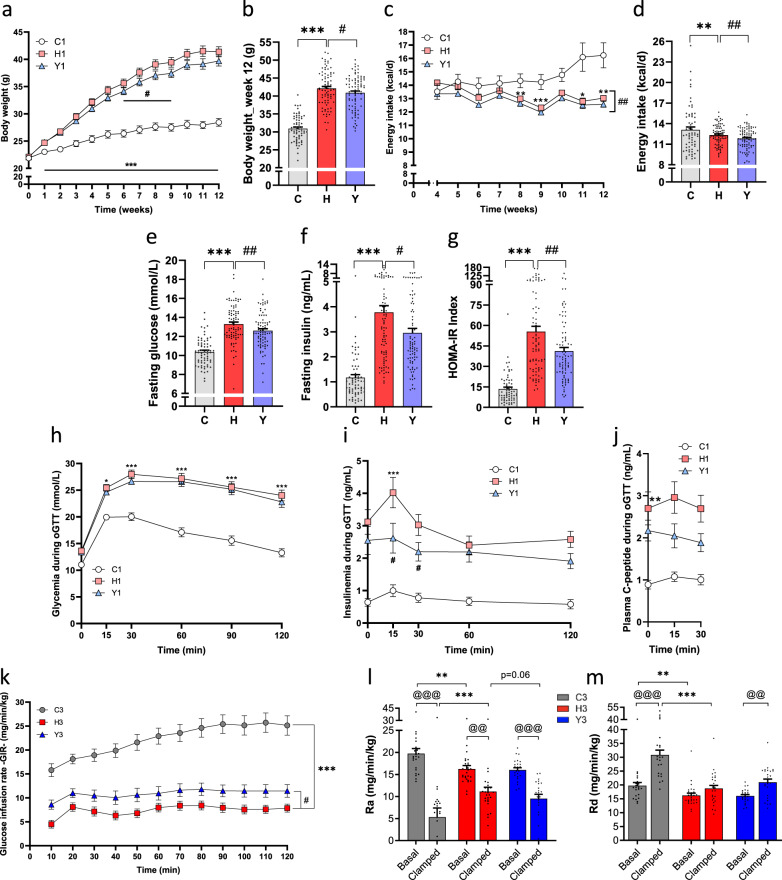
Fig. 1. Yogurt consumption preserves glucose homeostasis and insulin sensitivity.
Metabolic results of mice in the three studies (see also Supplementary Fig. 1 for the experimental design, Supplementary Data 1 and Supplementary Fig. 2). a Body weight throughout the Study 1. b Pooled analysis of the three studies showing mice final body weight after 12 weeks of dietary treatment. c Energy intake was recorded from week 4 to week 12 in Study 1. d Pooled analysis of the three studies showing mice daily energy intake. e–g Pooled analysis of fasting glucose, insulin, and corresponding HOMA-IR index after 12 weeks of treatment. h Glucose tolerance test at week 11 in Study 1. i Insulin response following the oral glucose challenge in Study 1. j C-peptide response following the oral glucose challenge in Study 1. k–m In Study 3, mice underwent an hyperinsulinemic-euglycemic clamp at week 12. k Glucose infusion rate (GIR). l Glucose rate of appearance (Ra) depicting hepatic glucose production. m Whole-body glucose rate disappearance (Rd) depicting glucose disposal. Data are expressed as mean ± SEM. Study 1: n = 18–24 except for panel (i) (n = 9–12) and (j) (n = 6–10); Study 3: n = 23–27; Pooled analysis: n = 66–84 biologically independent mice. H versus C: *p < 0.05, **p < 0.01, ***p < 0.001. Y versus H: #p < 0.05, ##p < 0.01. For clamps data, basal versus clamped condition: @@p < 0.01, @@@p < 0.001. C: low-fat low-sucrose control diet (C: soft gray, C1: white, C3: gray); H: high-fat high-sucrose diet with a protein mixture replacing casein (H: soft red, H1: pink, H3: red); Y: lyophilized yogurt incorporated in H diet (Y: soft blue, Y1: light blue, Y3: blue). Numbers (1, 2, 3) refer to the study affiliation. Two-way repeated-measures ANOVA or Mann–Whitney tests depending on data distributions with (a, h–j) or without (b–g, k–m) baseline adjustment. T-test at baseline (j). All tests were two-sided.

