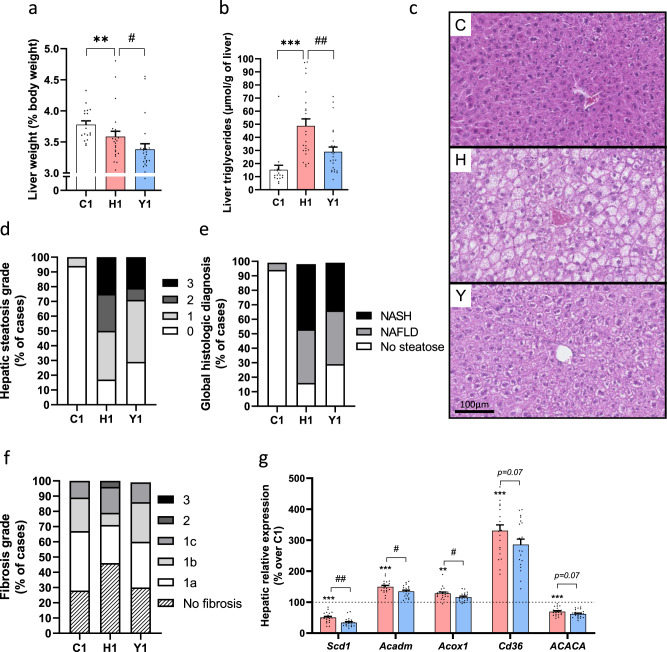
Fig. 2. Yogurt preserves hepatic steatosis and function.
Liver state in mice from Study 1. a Liver weight. b Hepatic triglyceride content. c Representative liver sections (hematoxylin and eosin staining) of n = 16–24 sections from independent mice. d, e Pathological analyses of liver sections. d Hepatic steatosis. e Global histologic diagnosis. f Fibrosis score. g Liver expression of genes involved in fatty acid uptake, de novo lipogenesis and fatty acid oxidation. Data are expressed as mean ± SEM. n = 18–24 biologically independent mice, except for panel (g) (n = 8 for C1 group, n = 20 for H1 and Y1 groups). H versus C: **p < 0.01, ***p < 0.001. Y versus H: #p < 0.05, ##p < 0.01. For panel (g) expressed in percentage, C group is considered as a reference and represented by a dash line. C: low-fat low-sucrose control diet (C1: white); H: high-fat high-sucrose diet with a protein mixture replacing casein (H1: pink); Y: lyophilized yogurt incorporated in H diet (Y1: light blue). Number (1) refers to the study affiliation. Mann–Whitney tests or T-test depending on data distributions (a, b). One-way ANOVAs and Benjamini–Hochberg adjustment for multiple testing on the number of variables (g). All tests were two-sided.

