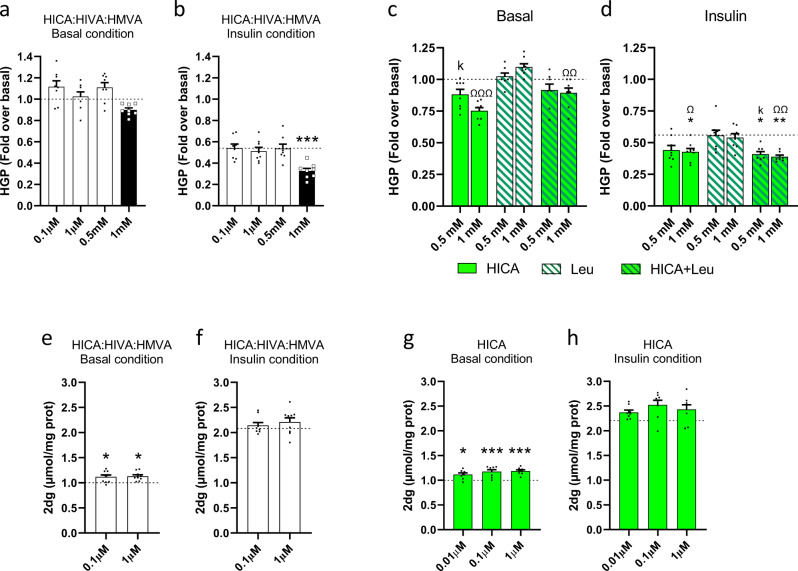
Fig. 5. BCHA are cell-autonomous modulators of liver and muscle glucose metabolism.
a HGP of FAO cells treated with 0.1 µM, 1 µM, 0.5 mM and 1 mM mixture of HICA: HIVA: HMVA (white) at molar ratio 1: 1: 0.5 in basal condition. b HGP of FAO cells treated with 0.1 µM, 1 µM, 0.5 mM and 1 mM mixture of HICA: HIVA: HMVA at molar ratio 1: 1: 0.5 in insulin-treated condition. c HGP of FAO cells treated with 0.5 and 1 mM of HICA (lawn green), leucine (white, hatched green), or a combination of both (lawn green, hatched green) in basal condition. d HGP of FAO cells treated with 0.5 and 1 mM of HICA, leucine, or a combination of both in insulin-treated conditions. e 2dg uptake of L6 cells treated with 0.1 and 1 µM mixture of HICA: HIVA: HMVA at molar ratio 1:1:0.5 in basal condition. f 2dg uptake of L6 cells treated with 0.1 and 1 µM mixture of HICA: HIVA: HMVA at molar ratio 1:1:0.5 in insulin-treated condition. g 2dg uptake of L6 cells treated with 0.01, 0.1 or 1 µM of HICA in basal condition. h 2dg uptake of L6 cells treated with 0.01, 0.1, or 1 µM of HICA in insulin-treated condition. Data are expressed as mean ± SEM. Vs control: *p < 0.05 versus control, ***p < 0.001. HICA 0.5 mM vs HIVA 1 mM: ∂∂p < 0.01. Vs Leu 0.5 mM: Kp < 0.05, KKp < 0.01, KKKp < 0.001. Vs Leu 1 mM: Ωp < 0.05, ΩΩp < 0.01, ΩΩΩp < 0.001. The basal and insulin controls are represented by a dash line. n = 8–9 independent experiments. One-way ANOVA followed by Dunnett’s post hoc test vs Control.

