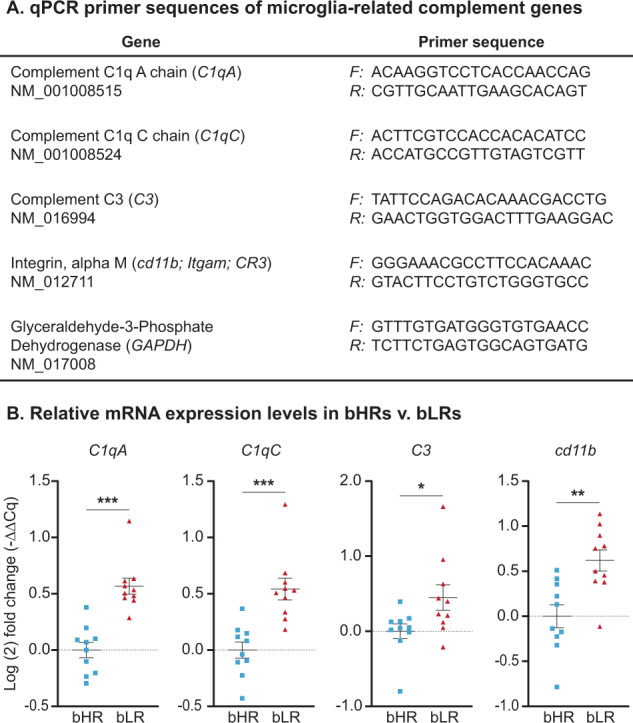
Fig. 1. Differential patterns of microglia-related gene expression in hippocampus following selective breeding.

A Primer sequences of genes used for qPCR experiments. All primers were validated in-house, and expression levels of GAPDH (reference gene) were not significantly different between bHRs and bLRs (Supplemental Materials, Fig. S1). B Elevated hippocampal expression (Log(2) fold change) for several genes within the classical complement cascade was found in bLRs compared to bHRs. Data are expressed as mean ± SEM, with scatter plots overlaid to show individual data points. Welch’s t-tests: bHR v. bLR, ***C1qA: t17.92 = 33.713, p < 0.001; ***C1qC: t16.63 = 20.305, p < 0.001; *C3: t14.52 = 5.258, p = 0.037; **Cd11b: t17.89 = 12.874, p = 0.0012.
