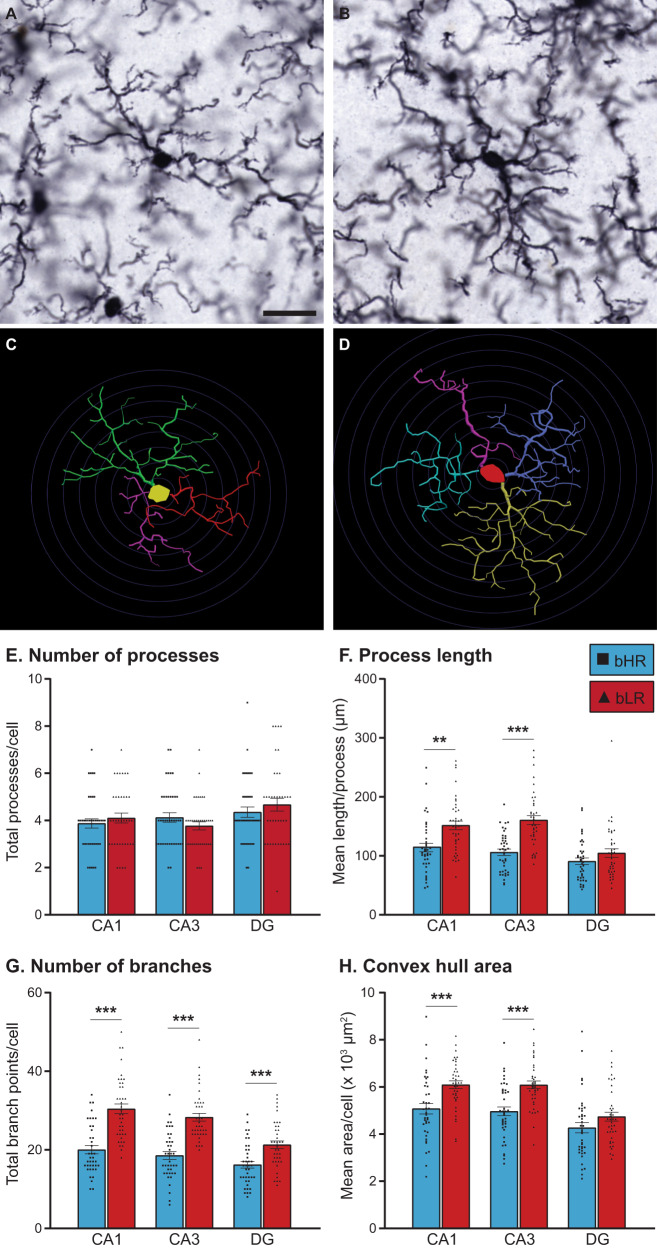
Fig. 5. Detailed morphological analyses of ramified microglia in bHRs and bLRs.
High-magnification photomicrographs (63x, oil) of typical ramified microglia from bHR (A) and bLR (B), with Neurolucida reconstructions for each cell shown in (C) and (D), respectively. Scale bar = 20 µm; Concentric circles applied at 5 µm increments in C and D for length comparisons. Reconstructions were analyzed using Neurolucida Explorer Software (MicroBrightField Bioscience). The main measurements are summarized here, with a full listing provided in Supplemental Materials. Although microglia from each line had similar totals of primary branches (E), bLR microglia had longer branches in CA1 (**t74 = 3.322, p = 0.001) and CA3 (***t74 = 5.765, p < 0.001) (F), and more branch points across all regions (***CA1: t74 = 6.267, p < 0.001; ***CA3: t74 = 7.012, p < 0.001; ***DG: t74 = 4.022, p < 0.001) (G), compared to microglia from bHRs. H Convex hull calculations, which reflect the overall territory area of the cell, were larger in bLRs in CA1 (***t74 = 3.909, p < 0.001) and CA3 (***t74 = 4.869, p < 0.001). Data are expressed as mean ± SEM, with scatter plots overlaid to show individual data points.

