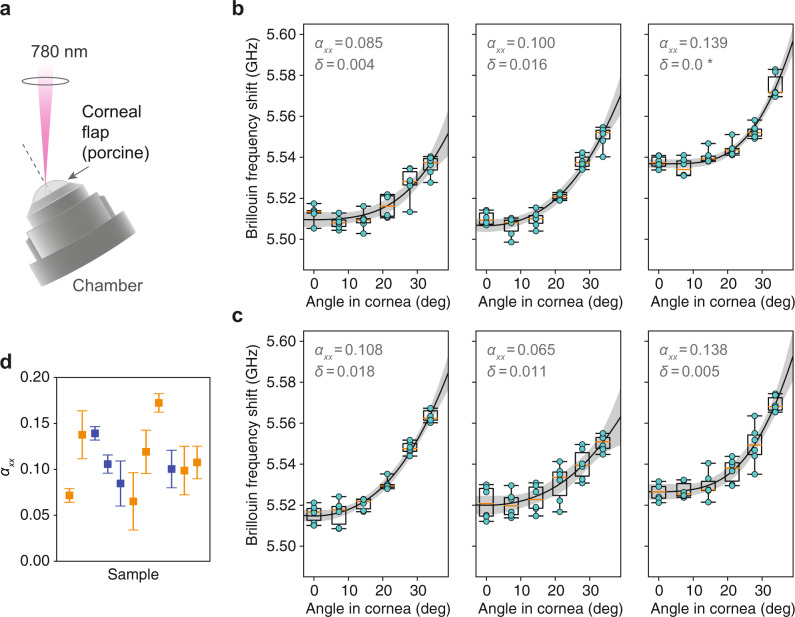
Fig. 4. Measurement of Brillouin angle-dependence in ex vivo porcine cornea.
a Schematic showing Brillouin angle-dependence measurements of the cornea mounted in a Barron chamber using a 0.1-NA, 780 nm optical beam. b Plots of Brillouin frequency shift measured at the center of the cornea with different in-tissue angles for 3 porcine samples (different animals). For each sample, the cycle of angle measurements was repeated six times (alternating increasing and decreasing angle) to minimize the impact of environmental drifts. Individual measurement points are shown in cyan, along with box plots for all six points at each angle setting. Best-fit curves are plotted (solid line) with 95% confidence bands (gray). Fitted values of αxx and δ are shown. c Plots of Brillouin frequency shift measured 2, 3, and 4 mm away from center (left to right, respectively) with different in-tissue angles for three porcine samples (different animals). d Distribution of fitted values for 11 corneas from 11 different animals. Error bars indicate confidence ranges. Points in blue correspond to the central cornea, while points in orange correspond to other locations 2–4 mm off center. Box-plots: center line, median; box limits, upper and lower quartiles; whiskers, range of data.

