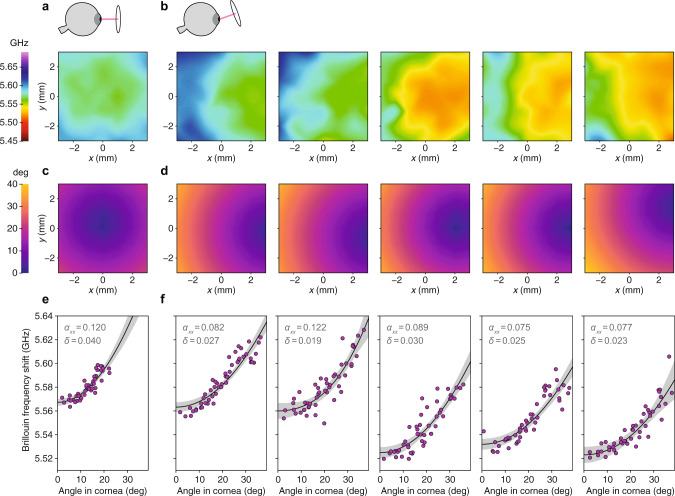
Fig. 6. Anisotropy in Brillouin maps of ex vivo porcine cornea.
a Brillouin frequency shift map of intact porcine cornea with laser incidence angle close to 0° at the corneal apex (see diagram above). b Brillouin map of the same cornea (left) and the corneas of four other animals (right) for a steeper set of laser incidence angles (see diagram above). c and d Maps showing computed laser incidence angle corresponding to the Brillouin maps above. The laser-cornea incidence angle varies slightly as the laser is translated in x (left-right) and y (up-down) to create the Brillouin map due to corneal curvature. e and f Plot of Brillouin values for each map versus computed incidence angle. The increasing Brillouin shift with angle is consistent with expected corneal anisotropy. Individual map data points (shown in magenta) were fit to the weak transverse isotropy model (Eq. (3)). Best-fit curves are plotted (solid line) with 95% confidence bands (gray). Fitted values of αxx and δ are shown.

