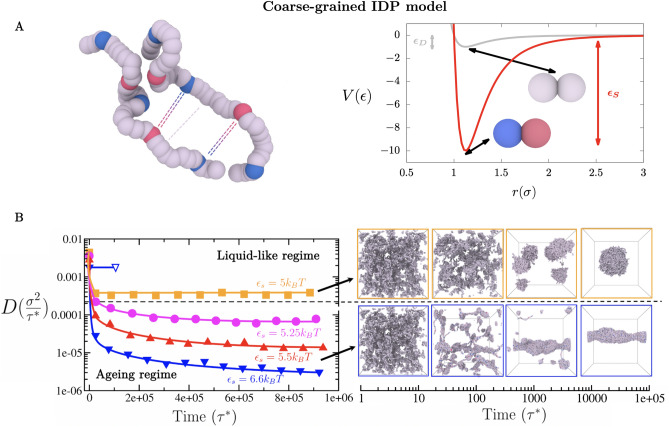
Figure 1.
(A) Coarse-grained representation of intrinsically disordered proteins composed of stickers of type A (depicted as blue beads), stickers of type B (depicted as red beads), and spacers (depicted as grey beads). The model considers transient weak interactions among spacer–spacer, spacer–sticker, and homotypic sticker–sticker pairs (i.e., sticker A–sticker A and sticker B–sticker B pairs; grey curve), and strong longer-lived interactions among heterotypic sticker A–sticker B pairs (red curve). A Lennard-Jones potential of different well-depths is used to represent the associative interactions among the different types of beads: is used for interactions between weakly binding bead pairs, and for interactions between strongly binding ‘sticker A–sticker B’ bead pairs. Each bead represents a group of 6–8 amino acids. Each protein is composed of 39 beads: 3 blue beads, 2 red beads and 34 grey ones. The excluded volume () of each segment type is the same. Results for an alternative CG representation of strong protein binding and a different protein sequence patterning to that depicted in (A) are available in the Supplementary Information. (B) Time-evolution of the protein diffusion coefficient (D) in the condensed phase for different interaction strengths (in T) between strongly-binding protein segments (please note that ). The horizontal black dashed line represents the kinetic threshold of our simulation timescale that distinguishes between ergodic liquid-like behaviour and ageing (transient liquid-to-solid) behaviour. Interaction strengths lower than T between the strongly-binding segments permit liquid-like behaviour (up to T and T where LLPS is no longer possible), while equal or higher strengths lead to the gradual deceleration of protein mobility over time as shown by D. However, in absence of strongly-binding segments (i.e., where all beads bind to one another with uniformly weak binding strength), liquid-like behaviour can be still observed even at values of T (empty blue triangle). Black arrows indicate the time dependent behaviour of condensates over time in the liquid-like (Top) and ageing regimes (Bottom). The time evolution snapshots of the condensate corresponds to systems with T (Top) and T (Bottom). Please note that these snapshots do not correspond to the NVT bulk systems employed to compute the diffusion coefficient in the B left panel.

