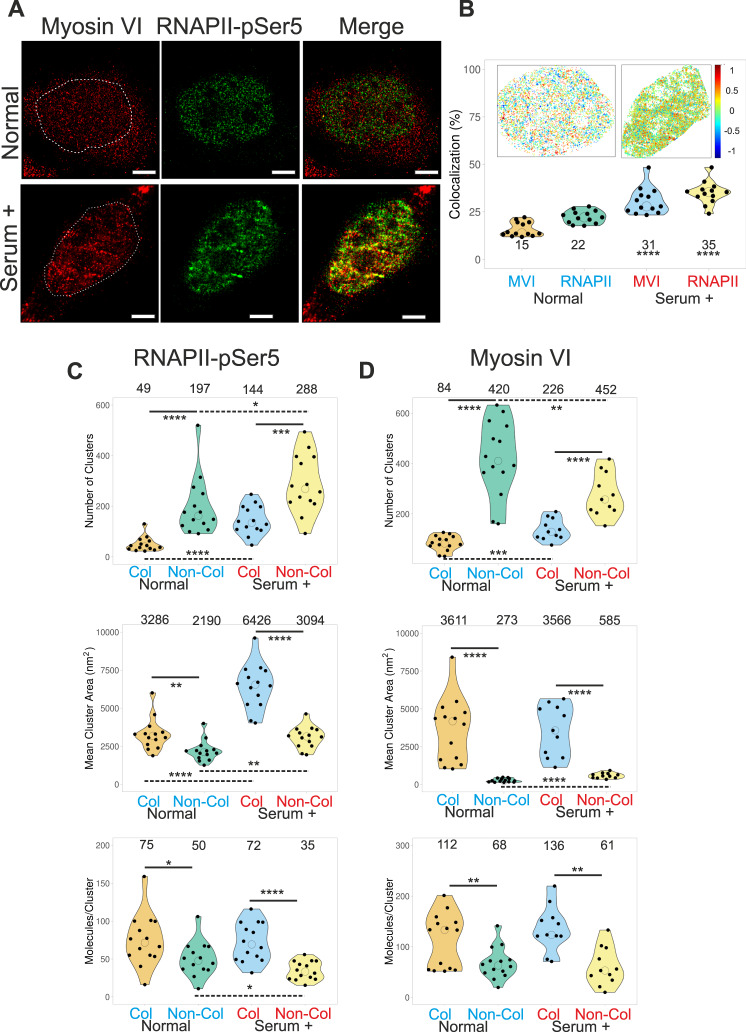
Fig. 2. Nuclear organisation of RNAPII and colocalization with Myosin VI.
A Example STORM render image of MVI and RNAPII-pSer5 under normal conditions and serum-treated conditions (scale bar 2 μm). B Co-localisation analysis of MVI and RNAPII-pSer5 clusters under normal and serum-treated conditions. Inset is a representative cluster colocalization heatmap whereby DoC values of 1 are perfectly colocalised and −1 are separated from each other. Individual data points represent the percentage of each protein which is colocalized based on DoC threshold of above 0.4 (n = 13) (see Fig. S6 for example histograms). The values represent the mean from the ROIs for each protein (Only statistically significant changes are highlighted ****p < 0.0001 by two-tailed t test compared to normal conditions for each protein). C Cluster analysis of RNAPII-pSer5 nuclear organisation under normal and serum-treated conditions. The data are broken down into myosin VI colocalized and non-colocalized clusters. Individual data points correspond to the average value for a cell ROI (n = 14). The values represent the mean from the ROIs for each condition (Only statistically significant changes are highlighted *p < 0.05; **p < 0.01; ***p < 0.001; ****p < 0.0001 by two-tailed t test compared to normal conditions). D Cluster analysis of myosin VI nuclear organisation under normal and serum-treated conditions. The data are broken down in to RNAPII-pSer5 colocalized and non-colocalized clusters. Individual data points correspond to the average value for a cell ROI (n = 14). The values represent the mean from the ROIs for each condition (Only statistically significant changes are highlighted **p < 0.01; ***p < 0.001; ****p < 0.0001 by two-tailed t test compared to normal conditions).

