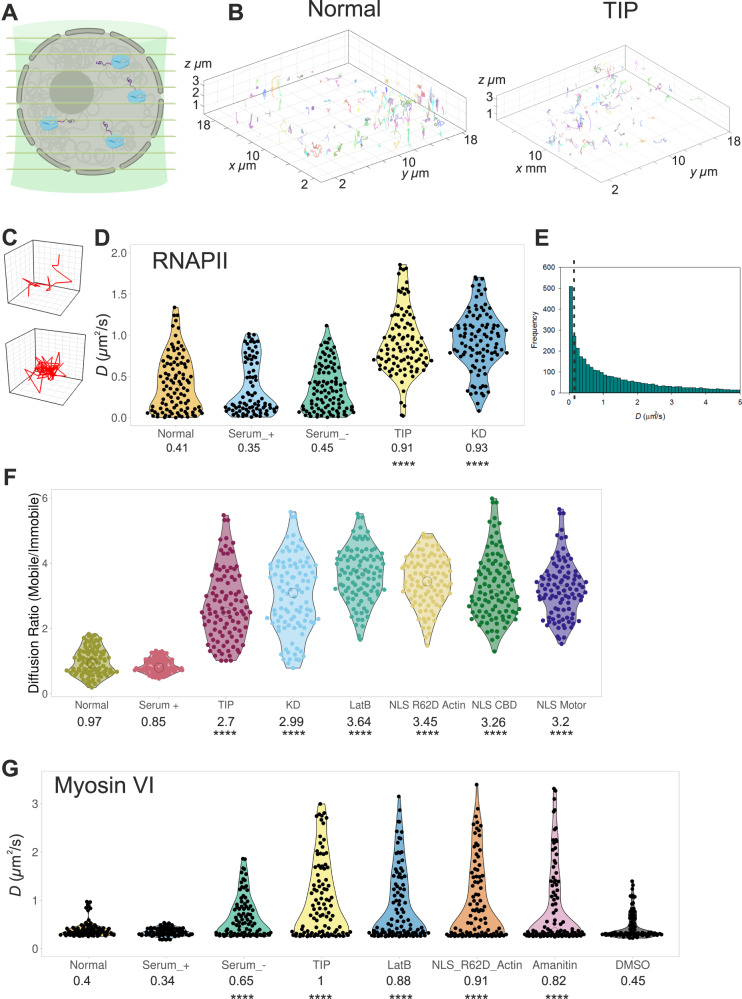
Fig. 5. Live-cell single-molecule dynamics of RNAPII.
A Cartoon depicting simultaneous acquisition of 9 focal planes covering 4 μm to perform live-cell 3D single-molecule tracking of RNAPII. B Example render of 3D single-molecule trajectories under normal and TIP-treated conditions. Further examples are shown in Supplementary Fig. 15. C Example trajectory of a diffusive and spatially confined molecule which can be identified in (B). D Plot of Halo-RNAPII diffusion constants under the stated conditions derived from fitting trajectories to an anomalous diffusion model, as described in methods. Individual data points correspond to the average value for a cell ROI (n = 100). The values represent the mean from the ROIs for each condition (Only statistically significant changes are highlighted ****p < 0.0001 by two-tailed t test compared to normal conditions). E Example histogram of diffusion constants arising from a single cell. The dotted line represents the threshold applied to segregate static and dynamic molecules. F Using the threshold defined in (E), trajectories were plotted as a ratio of mobile and immobile species. Individual data points correspond to the average value for a cell ROI. The values represent the mean from the ROIs for each condition (Only statistically significant changes are highlighted ****p < 0.0001 by two-tailed t test compared to normal conditions). NLS-R62D Actin, NLS CBD and NLS Motor refer to tracking of RNAPII following transfection of these constructs. NLS CBD and NLS motor were transfected in to Halo-RNAPII cells. G Plot of Halo-MVI diffusion constants under the stated conditions derived from fitting trajectories to an anomalous diffusion model, as described in methods. Individual data points correspond to the average value for a cell ROI (n = 100). The values represent the mean from the ROIs for each condition (Only statistically significant changes are highlighted ****p < 0.0001 by two-tailed t test compared to normal conditions).

