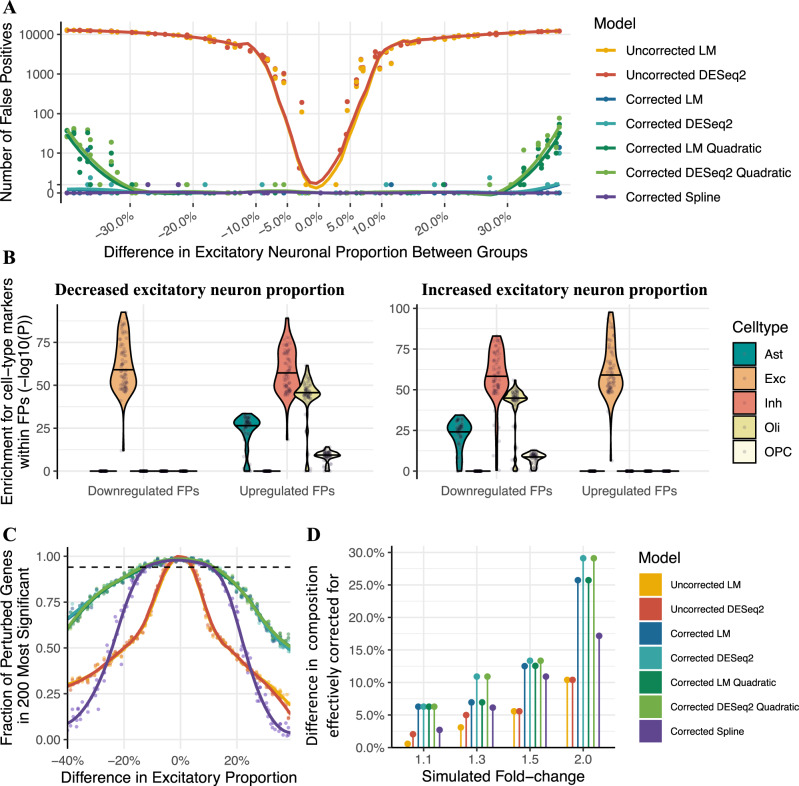
Fig. 4. Effect of brain cell-type composition on Differential expression (DE) analyses.
A Scatterplot of the number of false positive genes versus the simulated difference in excitatory neuron proportion between two groups of 50 samples. Each point represents a different simulated dataset. DE was assessed with either a linear model (LM) or DESeq2. Models labelled as “corrected” adjusted excitatory neuronal proportion as a covariate. Coloured lines: local regression line. B Cell-type marker enrichment within false positive genes. Each point represents a single simulated dataset. The width of the violin indicates point density, and the horizontal black bar indicates the median. y-axis: enrichment p-value (one-sided Fisher test, no correction for multiple testing); Methods. FPs false positive genes, Ast Astrocytes, Exc excitatory neurons, Inh inhibitory neurons, Oli oligodendrocytes, OPC oligodendrocyte precursor cells. C Scatterplot of the discriminatory power, i.e. fraction of the 200 perturbed genes in the top 200 most significantly differentially expressed genes (y-axis) versus simulated difference in excitatory neuron proportion between sample groups (x-axis) for simulated 1.5-fold expression differences. Coloured lines: local regression line. Dotted line: expected discriminatory power, i.e. 0.95 times the discriminatory power in the absence of cell-type composition differences between groups. D Model robustness to cell-type composition differences across a range of fold-changes, quantified as the smallest composition change where discriminatory power fell below its expected value. This is defined as 0.95 times the discriminatory power of an uncorrected linear model in a simulation with no composition confound (calculated separately for each simulated fold-change).

