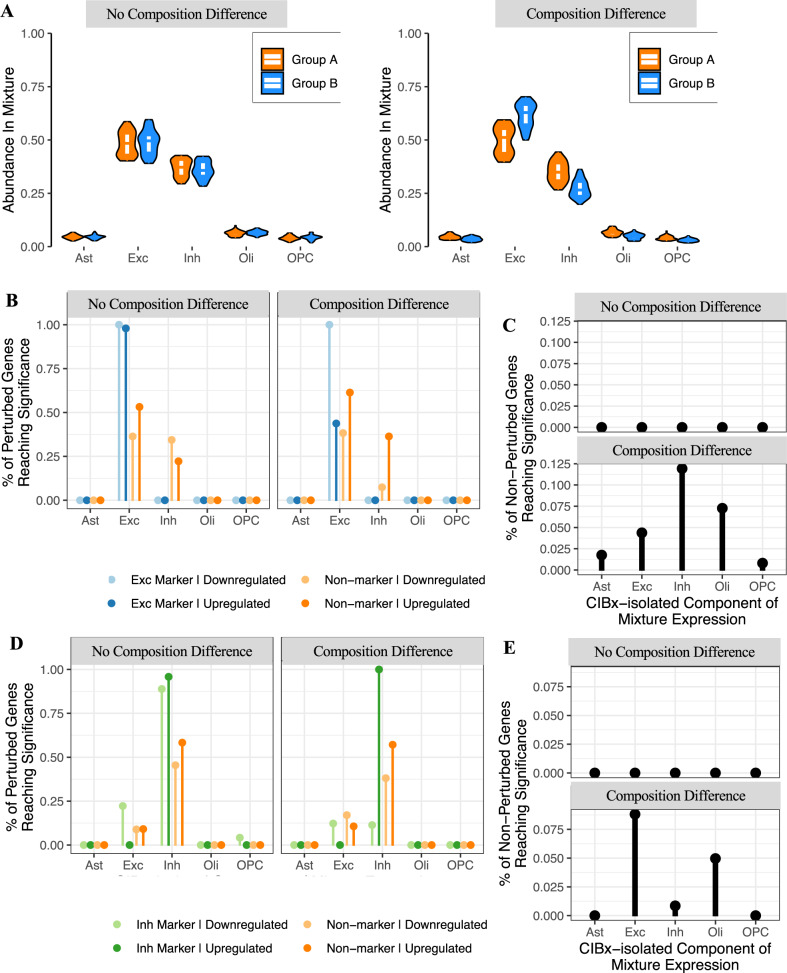
Fig. 5. Cell-type-specific differential expression analysis using CIBERSORTx.
A Violin plots showing the composition distribution of two simulated datasets. Each point represents the proportion of a given cell-type in each dataset. The width of the violin indicates point density, with the top, middle, and bottom of the white overlay box marking the 75th, 50th, and 25th percentiles, respectively. Left: simulated data without a composition difference between the two groups. Right: simulated data with a composition difference between the two groups. Each group contained 50 samples. B Gene expression was perturbed 1.5-fold in Group B in excitatory neurons for 100 non-marker genes plus 100 markers of the given cell-type. CIBERSORTx was used to extract cell-type-specific expression (see the “Methods” section), with a linear model then run to assess differential expression in each cell-type. The plot displays the fraction of the true perturbed genes with an FDR < 0.05. Note that the fraction was calculated using only the subset of perturbed genes which were detected in the given cell-type. C False positive rate across the different cell-types when expression was perturbed in excitatory neurons with or without an additional composition difference. D As per B with the expression perturbation in inhibitory neurons. E As per C with the expression perturbation in inhibitory neurons. Ast astrocytes, Exc excitatory neurons, Inh inhibitory neurons, Oli oligodendrocytes, OPC oligodendrocyte precursor cells.

