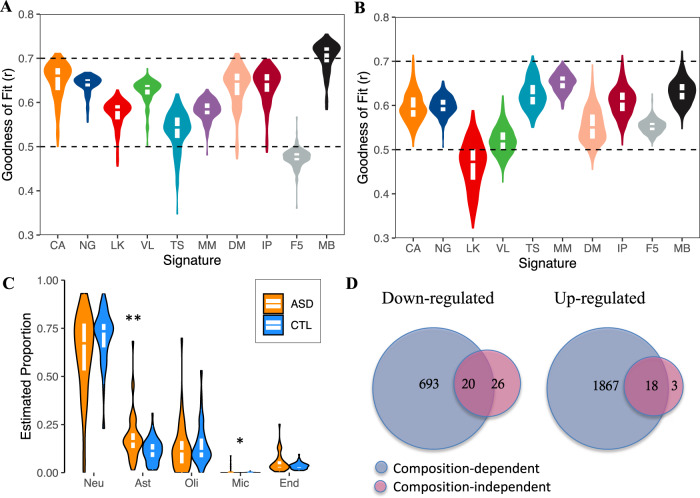
Fig. 6. Cell-type composition estimates in large-scale human brain transcriptome data.
A and B Violin plots of goodness of fit across signatures in cortex samples from (A) the GTEx consortium and (B) Parikshak et al. Deconvolution was performed using CIBERSORT. The width of the violin indicates point density, with the top, middle, and bottom of the white overlay box marking the 75th, 50th, and 25th percentiles, respectively. Dotted horizontal lines: y = 0.5 and y = 0.7. Signatures in the x-axis are as follows: VL Velmeshev, NG Nagy, CA Human Cell Atlas, LK Lake, TS Tasic, F5 FANTOM5, IP Immuno-paned, MM mouse immuno-panned, DM Darmanis, MB MultiBrain. See the “Methods” section for further details about signatures. C Violin plots of composition estimates in ASD (n = 43) and Control (n = 63) cortical samples from Parikshak et al.32. Deconvolution was performed using CIBERSORT and the MultiBrain signature. ASD autism spectrum disorder, CTL control. *p < 0.01. **p < 0.001. p-values were calculated using a two-sided Wilcoxon test, without multiple-testing adjustment. The width of the violin indicates point density, with the top, middle, and bottom of the white overlay box marking the 75th, 50th, and 25th percentiles, respectively. D Venn diagrams of the overlap between composition-dependent and composition-independent differentially expressed genes between ASD and CTL samples. Differential expression was performed using DESeq2. The composition-independent model included astrocyte, oligodendrocyte, and microglial proportions as covariates.

