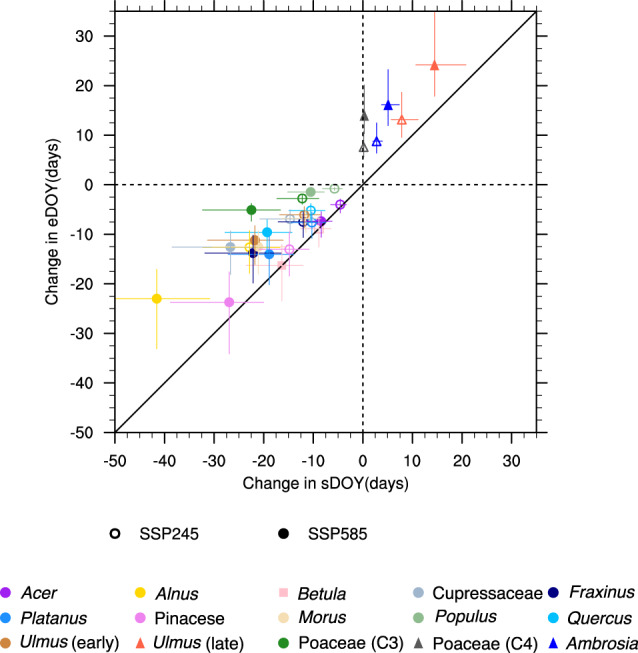
Fig. 1. Future change in pollen season start date and end date.

The projected change of start day of year (sDOY) and end day of year (eDOY) of pollen season at the end of century (2081–2100) for individual taxa. Each symbol represents the multi-model mean of the spatially and temporally averaged 15 model members. Error bars represent the minimum and maximum from the 15 CMIP6 (Coupled Model Intercomparison Project Phase 6) model ensembles (n = 15). Open (Shared Socioeconomic Pathway (SSP) 245) and closed (SSP 585) symbols indicate the results from different future emissions scenarios. Circles represent the taxa in Category 1, squares in Category 2, and triangles in Category 3 (visualized in Fig. 1). 1:1 reference in provided with the solid black line. Source data are provided as source data file.
