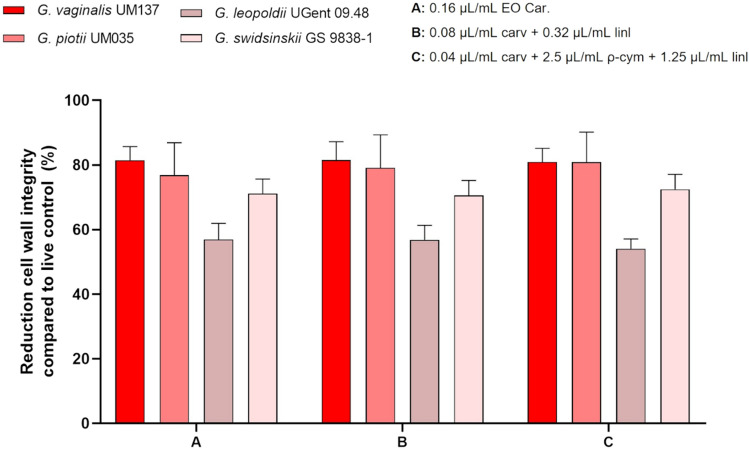
Figure 5.
Results from LIVE/DEAD quantitative analysis of G. vaginalis UM137, G. piotii UM035, G. leopoldii UGent 09.48 and G. swidsinskii GS 9838-1 48 h biofilms after the activity of EO Car. and two combinations of compounds. The results are shown in percentage of reduction of cell wall integrity compared to live control. Error bars represent s.d. No statistical differences were found when using a t-test (n = 3) comparing the different conditions within the same tested species. All conditions are statistically different from the control.

