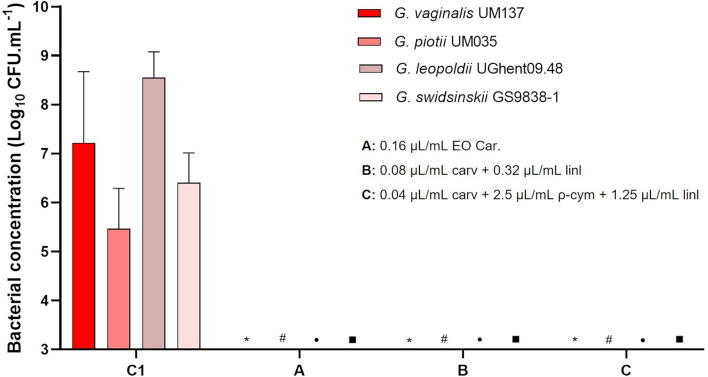
Figure 6.
Analysis of biofilm cells culturability recovery of different Gardnerella species after the effect of EO Car. and specific combinations of compounds. The experiments were performed after 96 h of biofilm formation with sBHI medium. Results are represented as mean of Log (CFU.mL−1) with a limit of detection of Log = 3, and the error bars represent s.d. Statistical analysis was performed using a t-test (n = 4). Differences are represented when p < 0.05, when compared with control of G. vaginalis UM137 (asterisk symbol), G. piotii UM035 (hash symbol), G. leopoldii UGent 09.48 (bullet symbol) and G. swidsinskii GS 9838-1 (filled square symbol). C1: control (48 h-biofilm + 24 h sBHI + 24 h sBHI); A: 0.16 µL/mL EO Car; B: 0.08 µL/mL carv + 0.32 µL/mL linl; C: 0.04 µL/mL carv + 2.5 µL/mL ρ-cym + 1.25 µL/mL linl.

