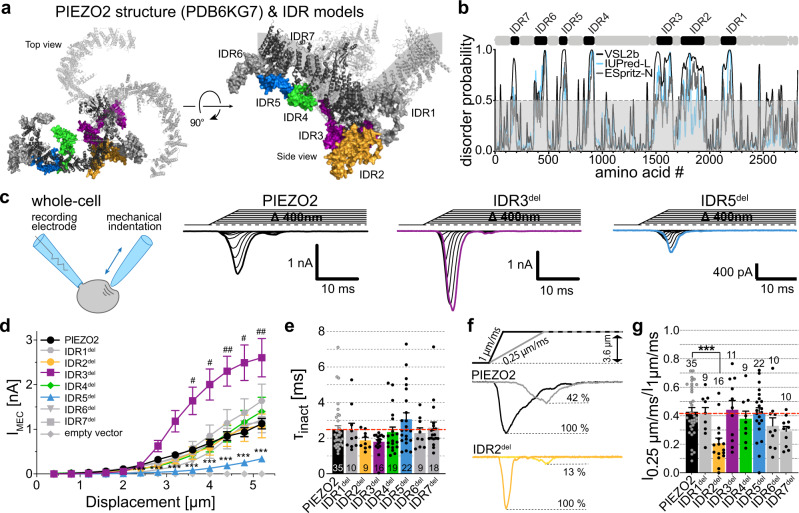
Fig. 1. Deletion of IDR2, IDR3 and IDR5 alters membrane indentation-evoked PIEZO2 currents.
a Top and side view of the mouse PIEZO2 structure. IDR regions were modeled with SWISS-MODEL and combined with the partial cryo-EM PIEZO2 structure (6KG7). Note, QMEAN-values of the IDRs were low and thus the model solely serves as an orientation guide for the approximate size and localization of the IDRs. b mPIEZO2 amino acid sequence-based disorder predictions (bottom) determined using IUPRED-L (blue), PONDR-VSL2b (black) and ESpritz-N (gray). Positions of the IDRs are indicated above the graph. c Recording configuration cartoon and example traces of whole-cell currents evoked by mechanical indentation of N2a cells expressing PIEZO2 (black, left), IDR3del (purple, middle) and IDR5del (blue, right). d Displacement-responses curves of peak current amplitudes of PIEZO2, IDRdel mutants and empty vector in N2a-P1KO cells. Symbols are mean ± s.e.m. N-numbers vary within groups because large mechanical stimuli occasionally damage the cells; PIEZO2 (N0.4–4 µm = 35, N4.4 µm = 33, N4.8 µm = 30, N5.2 µm = 29), IDR1del (N = 10), IDR2del (N0.4–4 µm = 9, N4.4 µm = 8, N4.8 µm = 6, N5.2 µm = 5), IDR3del (N0.4–4.4 µm = 16, N4.8 µm = 14, N5.2 µm = 13), IDR4del (N0.4–4.4 µm = 19, N4.8 µm = 17, N5.2 µm = 16), IDR5del (N = 22), IDR6del (N0.4–4.8 µm = 9, N5.2 µm = 6), IDR7del (N0.4–2.8 µm = 18, N3.2 µm = 16, N3.6–4.0 µm = 15 N4.4 µm = 13, N4.8 µm = 11, N5.2 µm = 7), empty vector (N = 15). Comparison with Kruskal–Wallis test and Dunn’s post-test. P-values for PIEZO2 vs IDR5del (from left to right): ***0.0000007, ***0.0000003, ***0.0000002, ***0.000001, ***0.000002, ***0.00002, ***0.000138, ***0.000041. P-values for PIEZO2 vs IDR3del (from left to right): #0.0239, #0.0232, ##0.0054, #0.0186, ##0.0098. e Comparison of the inactivation time constants (τinact) of PIEZO2 and IDRdel-mutants using with Kruskal–Wallis (p = 0.1531). N-numbers are indicated within bars. f Example traces of PIEZO2 and IDR2del currents evoked by stimuli of different velocities and (g) comparison of the current amplitude ratios (I0.25µm/ms/I1µm/ms) of PIEZO2 and all IDR-deletions using One-Way ANOVA, F(7, 114) = 3.771 and Dunnett’s post-test (PIEZO2 vs IDR2del, ***p = 0.0002). Bars represent means ± s.e.m with ratios values from individual cells shown as black circles and N-numbers per group being indicated above the bars. Source data are provided as a Source Data file.

