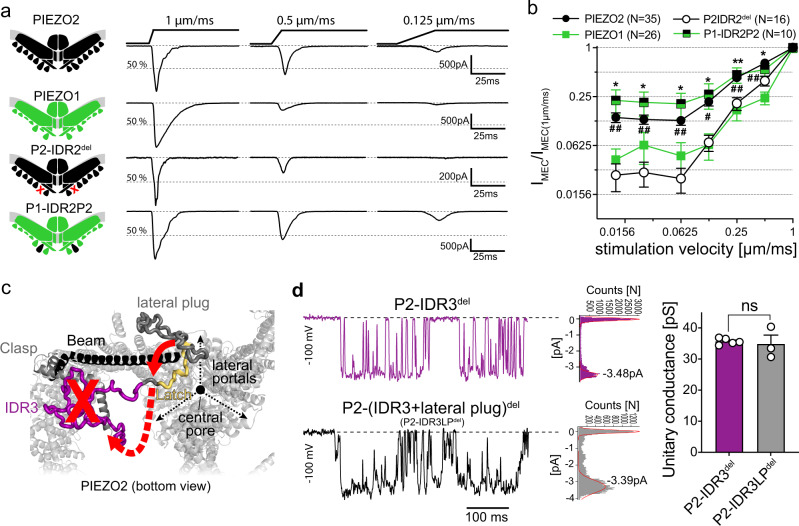
Fig. 3. IDR2 and IDR3 control velocity sensitivity and single-channel conductance of PIEZO2, respectively.
a Example traces of currents evoked by mechanical ramp-and-hold stimuli with the indicated ramp speeds (right) in cells expressing the illustrated PIEZO channels/chimeras (left). b Comparison of the velocity sensitivities of PIEZO2 (N = 35), P2-IDR2del (N = 16), PIEZO1 (N = 26) and P1-IDR2P2 (N = 10). Graph shows the mean normalized current amplitudes ±s.e.m. of the indicated channels, as a function of stimulation velocity. Comparison with Kruskal–Wallis and Dunn’s post-test was performed separately for each tested velocity: P-values for PIEZO2 vs IDR2del (from left to right): ##0.0012, ##0.0036, ##0.0015, #0.0237, ##0.005 ##0.0047 and P-Values for PIEZO1 vs P1-IDR2P2 (from left to right): *0.0196, *0.025, *0.0105, *0.0379, **0.0076, *0.0219. c Cartoon illustrating the possible structural changes induced by IDR3 deletion. Deletion of IDR3 (red X) might cause dislocation (red dashed arrow) of the latch (yellow) and the lateral plug (red arrow) such that the lateral portals become unblocked and single-channel conductance increases. d Example traces of stretch-evoked single-channel currents mediated by IDR3del (top, purple) and IDR3del + LateralPlugdel mutant (bottom, black) are shown alongside with the corresponding current amplitude distribution histograms with Gaussian fits of the single channel opening peak. Bar graphs (right) represent mean ± s.e.m. unitary conductances of IDR3del and IDR3del + LateralPlugdel, with individual values from 5 (P2-IDR3del) and 3 (P2-IDR3LPdel) independent cells shown as white circles. Comparison with Mann–Whitney test (p = 0.5714). Source data are provided as a Source Data file.

