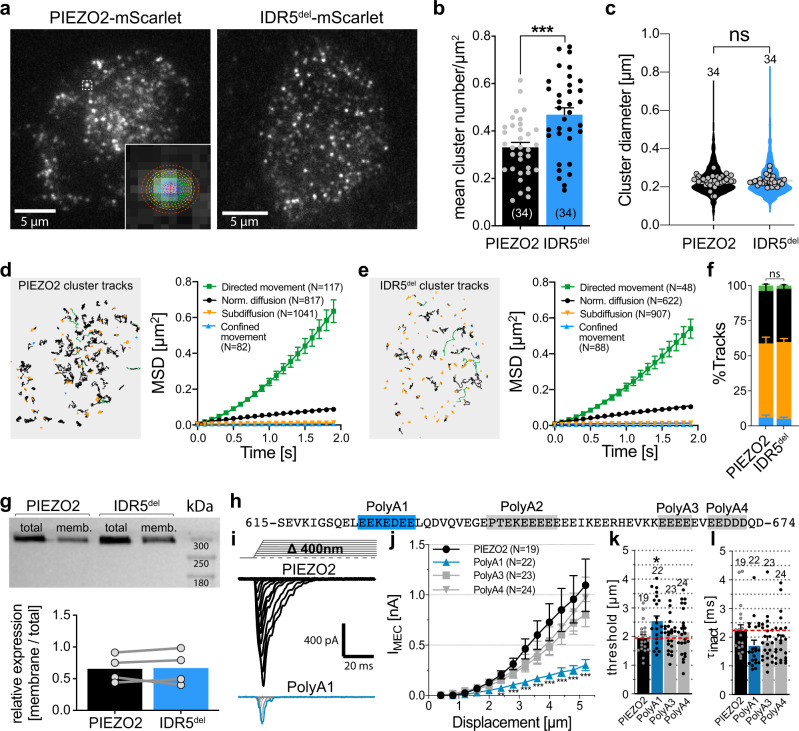
Fig. 4. IDR5 deletion does not affect PIEZO2 trafficking, clustering or lateral diffusion in the plasma membrane.
a Example TIRF images of PIEZO2-mScarlet and IDR5del-mScarlet clusters. Inset shows Gaussian fit of a PIEZO2 cluster. b Mean cluster densities of 34 PIEZO2-mScarlet (black) and 34 IDR5del-mScarlet (blue) expressing cells were compared with unpaired t-test (***p = 0.0003). Error bars represent s.e.m. and means from individual cells are shown as circles. c Violin plot of individual cluster diameters (PIEZO2, N = 2153 and IDR5del, N = 2765) and mean cluster diameters per cell (gray circles, N = 34). Mean cluster diameters were compared using Mann–Whitney test (p = 0.3152). Tracks of the clusters shown in (a) (left) for PIEZO2 (d) and IDR5del (e) and plots of the Mean-Squared-Displacement as a function of lag time (right) for the 4 track categories. Symbols represent means ± s.e.m. Tracks from 2057 PIEZO2 and 1665 IDR5del clusters from 13 cells each were analyzed (N-Numbers for track-categories are provided in graph). f Proportions of clusters assigned to the different track categories from 13 PIEZO2 and 13 IDR5del-expressing cells are shown in a stacked bar graph (mean ± s.e.m.) and compared using Mann–Whitney test, (Directed p = 0.2555, Norm. Diffusion p = 0.9197, Subdiffusion p = 0.6597, Confined p = 0.99; color-code same as in d). g Western blot of whole-cell lysate (total) and biotinylated membrane fraction (memb.) of PIEZO2 and IDR5del-transfected N2a-P1KO cells and bar graph of densitometric quantification (means with individual values from 4 independent assays. Mann–Whitney test, (p = 0.7553). h PIEZO2-IDR5 sequence with positions of PolyA substitutions highlighted. i Example traces of poking-evoked PIEZO2 and PolyA1-mediated whole-cell currents. j Displacement-responses curves of current amplitudes of PIEZO2 and PolyA mutants. For each stimulus, current amplitudes were compared with Kruskal–Wallis test and Dunn’s post-test. P-Values for PIEZO2 vs PolyA1 (from left to right): **0.004, ***0.0007, ***0.0003, ***0.0002, ***0.0001, ***0.0002, ***0.0002, ***0.0002). k, l comparisons of the mean ± s.e.m. mechanical activation thresholds and inactivation time constants of PIEZO2 and PolyA1 mutants with One-Way ANOVA, (F(3, 84) = 2.863; Dunnett’s post-test PIEZO2 vs PolyA1, *p = 0.0211) and Kruskal–Wallis test (p = 0.1997), respectively. N-numbers per group are provided above each bar. Source data are provided as a Source Data file.

