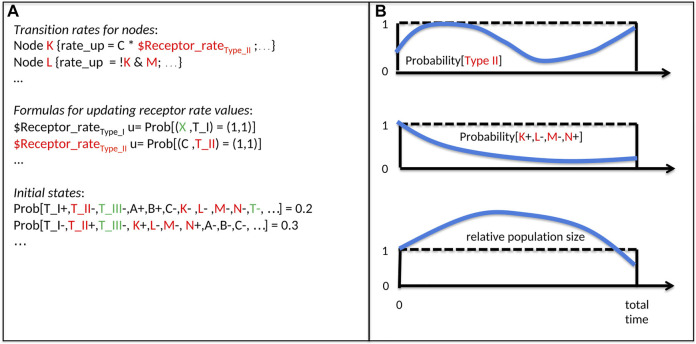
FIGURE 2.
Inputs and Outputs of an UPMaBoSS model. The notation is related to Figure 1: A, B, C, K, L, M represent genes/proteins; T_I, T_II, T_III represent cell types. (A) Inputs of UPMaBoSS: Transition rates for nodes: for each node (here K and L of Figure 1), a logical rule, the rate up and rate down are written; Formulas for updating receptors rates values: the update rules, starting by u = …, depend on the population state and regulate the value of the external variable $Receptor_rate of cell type I and II; and initial states: they can be defined such that cell types, proteins, etc. can be characterized as present (+) or absent (−) with a probability for this model state to be active initially. Colors correspond to cell types of Figure 1. Note that names starting with a $ correspond to external variables, specific to MaBoSS/UPMaBoSS, listed in bnd file, set up in cfg file and updated in upp file. (B) Ouputs of UPMaBoSS: time-dependent probabilities of cell types (upper panel, example of cell type II from Figure 1), with the corresponding model states (middle panel), and the time-dependent population size (lower panel).

