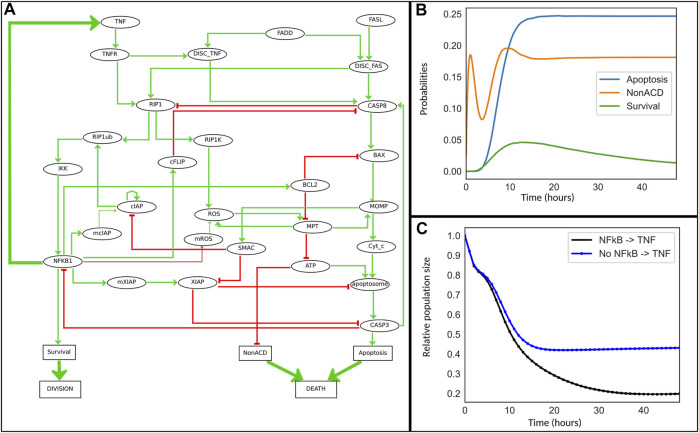
FIGURE 4.
Cell fate model for TNFα resistance. (A) This model is an extension of the model reported in (Calzone et al., 2010). Some nodes representing the mRNA of cIAP, ROS and XIAP family members have been added. The ellipsoid nodes represent genes, mRNA, proteins, or complexes, while the rectangular nodes denote phenotypes. Green and red arrows represent positive and negative influences, respectively. The thick green arrows denote activating interactions added to the initial model: a feedback from NFκB to TNFα encodes the ligand-receptor activation, while the “Division” and “Death” nodes have been introduced specifically for UPMaBoSS population updates. (B) Simulation of the cell fate model with MaBoSS for 48 h. (C) Simulation of the model with UPMaBoSS: temporal evolution of population sizes with (black) and without (blue) the TNF paracrine signaling.

