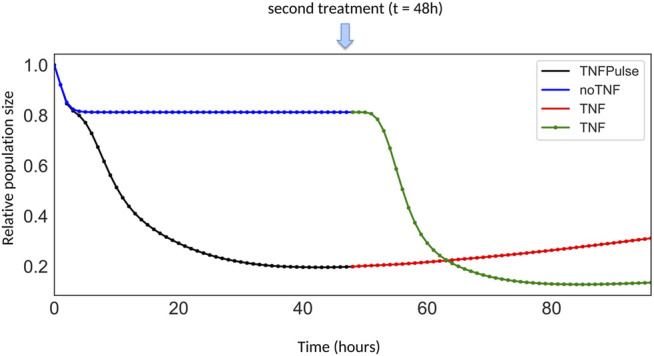
FIGURE 5.

Growth curves for different TNF treatment scenarios. The first scenario corresponds to the simulation of cells initially treated by a pulse of TNF (black segment), followed by a constitutive TNF treatment at t = 48 h (red segment). The other scenario corresponds to the simulation of cells initially untreated (blue segment), but receiving a constitutive TNF treatment at t = 48 h (green segment).
