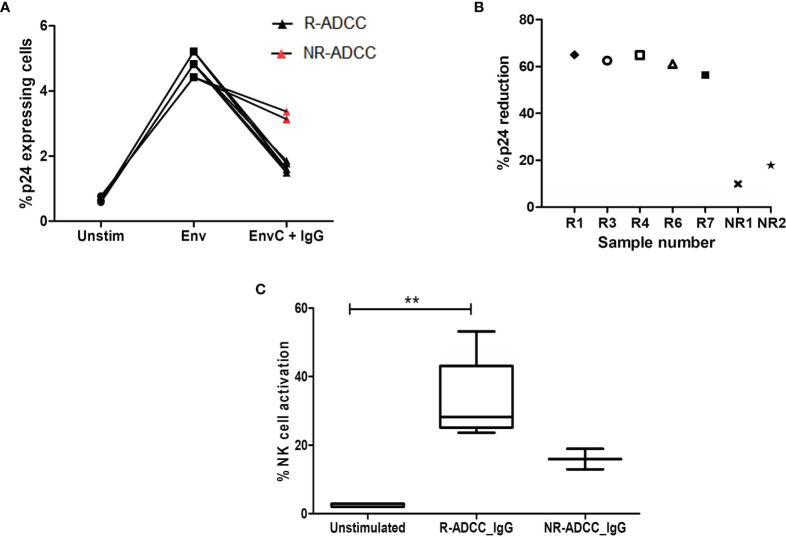
Figure 5.
Assessment of killing of reactivated HIV-1 latent reservoirs by the generated ADCC antibodies. (A) The line diagram shows the % p24-expressing CD4+CD45RO+ resting memory T cells (Y-axis) in unstimulated cells, after Env C stimulation and after the addition of antibodies generated from R-ADCC LTNPs (black dots) and NR-ADCC LTNPs (red dots) to the Env-stimulated cells (X-axis). (B) The scatter plot shows % p24 reduction (Y-axis) in five R-ADCC LTNPs (R1, R3, R4, R6, and R7) and 2 NR-ADCC LTNPs (NR1 and NR2) (X-axis). (C) The box and whiskers plots % NK cell activation (Y-axis) in unstimulated cells, after Env C stimulation and after the addition of antibodies generated from R-ADCC LTNPs and NR-ADCC LTNPs to the Env-stimulated cells (X-axis). The Wilcoxon matched-pairs t-test was used to analyze the data and p ≥0.05 was considered to be significant. The ** represents P ≤ 0.01.

