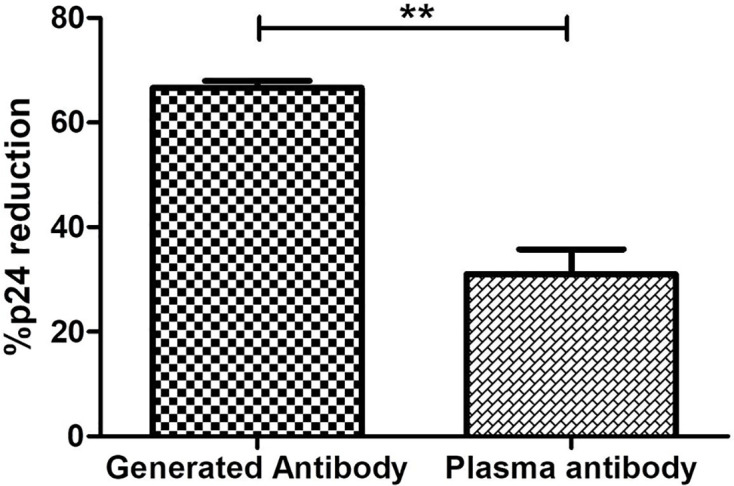
Figure 6.

Comparison of potency to reduce latent reservoirs of generated antibodies and paired plasma antibodies. The bar diagram represents the comparative analysis of reduction in percent p24-expressing resting memory CD4+ T cells in the presence of antibodies generated from R-ADCC (n = 5) LTNPs and purified plasma antibodies of the same LTNPs (n = 5) (paired t-test, p = 0.0016). The ** represents P ≤ 0.01.
