Figure 3.
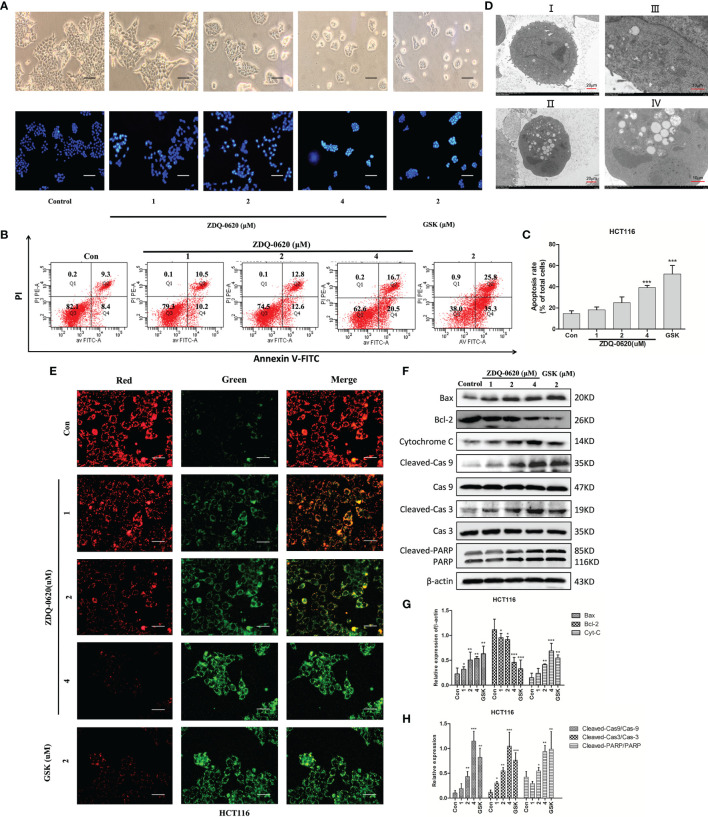
ZDQ-0620 induces HCT116 cells apoptosis. (A) Morphology of the cells (magnification, ×40) and Hoechst 33342 staining results. Apoptotic cells are bright blue; scale bar, 50 μm. (B) Analysis of the apoptotic effects of ZDQ-0620 and GSK2126458 by Annexin V/propidium iodide (PI) staining. (C) The histograms show the percentages of apoptotic HCT116 cells following treatment with ZDQ-0620 and GSK2126458 for 48 h (right). (D) Transmission electron microscopic analysis of the morphological changes occurring in cells after 48 h treatment (I and II: scale bar = 20 μm [left]; III and IV: scale bar = 10 μm [right]). (E) Effect of mitochondrial membrane potential detection on HCT-116. At high mitochondrial membrane potential, JC-1 aggregates in the matrix of mitochondria and forms a polymer (J-aggregates), which produces red fluorescence. At low mitochondrial membrane potential, JC-1 could not aggregate in the mitochondrial matrix, and as a monomer, JC-1 could produce green fluorescence; scale bar, 100 μm. (F) The expression levels of apoptosis-related proteins were detected by western blot. (G, H) Bar graph of the quantitative result. Each value is the mean (± SD) from triplicate samples; *p < 0.05, **p < 0.01, ***p < 0.001 vs. the control. One-way analysis of variance followed by Tukey’s post hoc multiple-comparisons test.

