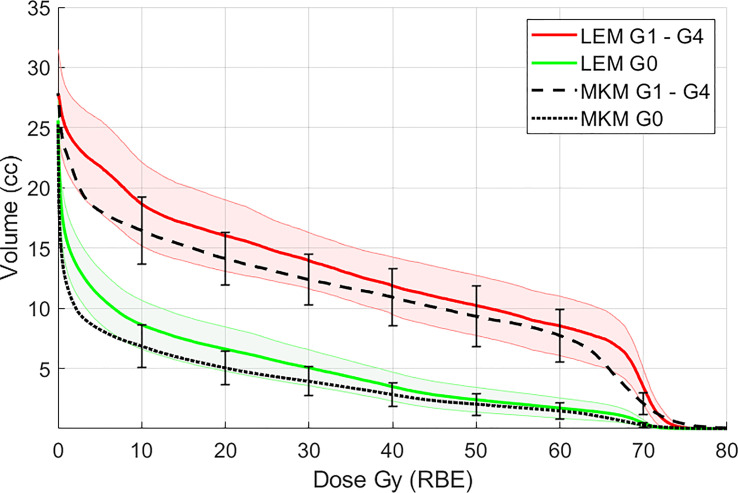
Figure 2.
Mean maxillary volumes at incremental dose levels from 10 to 60 Gy (RBE) calculated with the LEM model in patients with ORN (G1–G4, red solid line) vs patients without ORN (G0, green solid line). In black the maxilla DVH averaged for all the patients for the MKM model is also presented. Shaded bands and vertical error bars represent 2 SEM (Standard Error of the Mean) for the LEM and MKM model, respectively.

