
Figure-1.
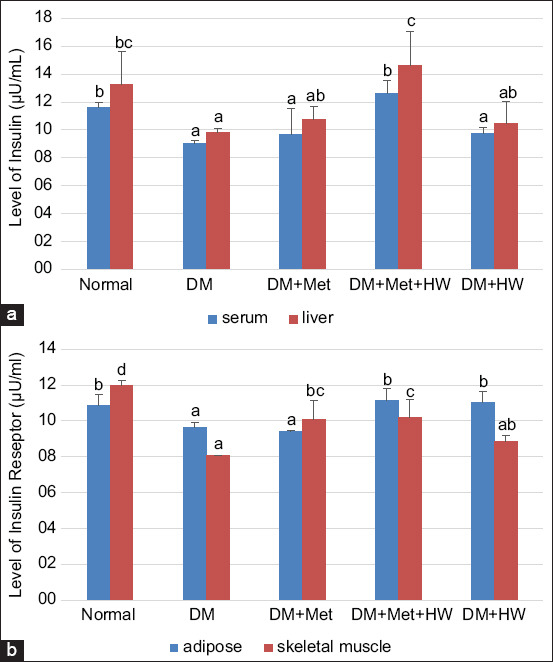
The level of insulin and insulin receptor (IR) in each group. (a) The level of insulin in serum and liver based on enzyme-linked immunosorbent assay (ELISA) method at each group. (b) The level of IR in adipose and skeletal muscle tissue based on ELISA method at each group. The different letters indicate significant differences between groups (p<0.05) according to Duncan’s multiple range test post hoc test.