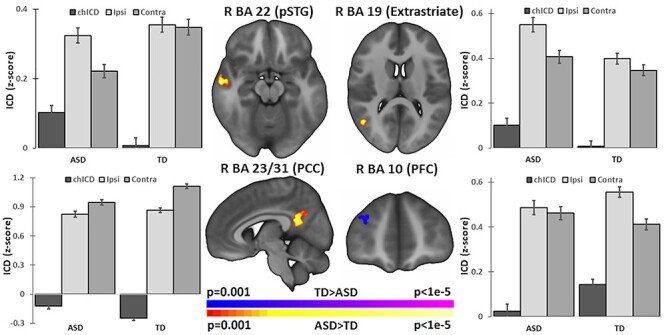
Figure 1 .

Group differences in connectivity hemispheric specialization at school-age. Group comparison (ASD vs. TD) identified four regions of atypical connectivity asymmetry: right pSTG (R BA 22), right extrastriate cortex (R BA 19), right PCC (R BA 23 and R BA 31), and right anterior PFC (R BA 10). Bar charts next to each image highlight the contribution of ipsilateral (ipsi) and contralateral (contra) connections to chICD differences. In other words, the plotted chICD values are the difference between the plotted ipsi and contra values. Error bars represent standard errors. Imaging results shown at P < 0.05 corrected and in radiologic convention.
