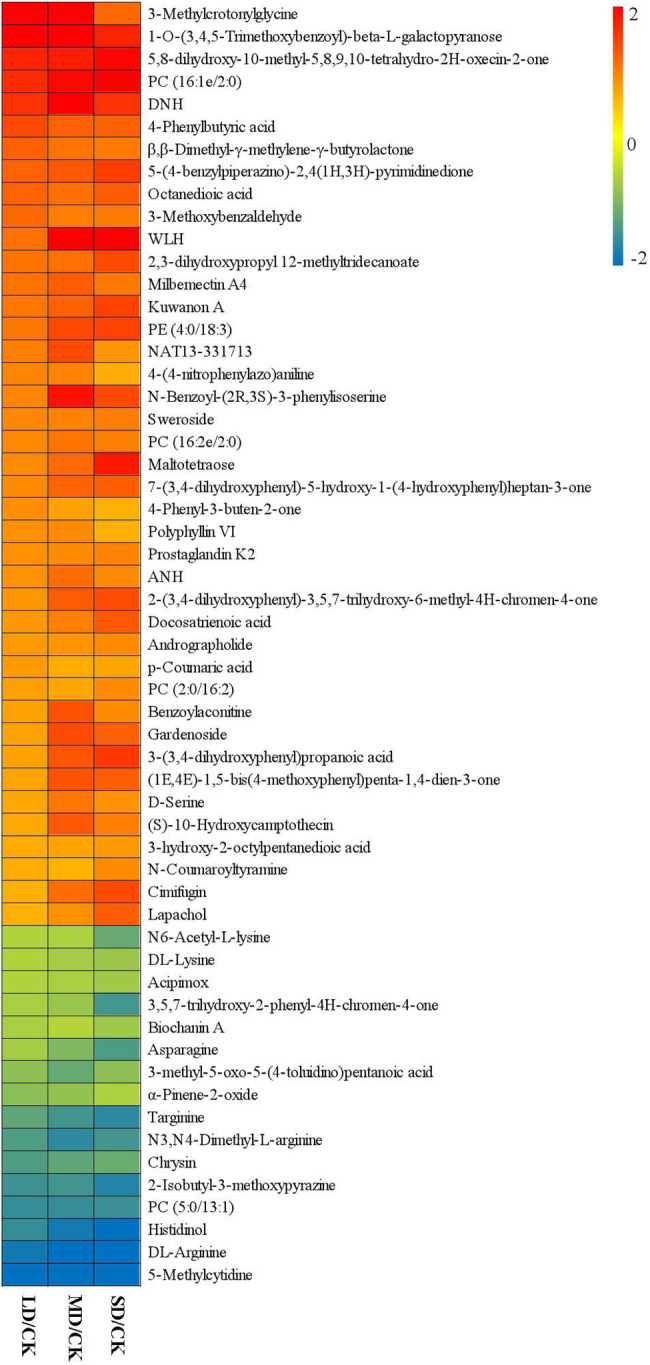
Figure 4.

Fold-changes (FCs) of 57 common differentially accumulated metabolites in the four treatment groups. Green indicates downregulated expression, and red indicates upregulated expression.

Fold-changes (FCs) of 57 common differentially accumulated metabolites in the four treatment groups. Green indicates downregulated expression, and red indicates upregulated expression.