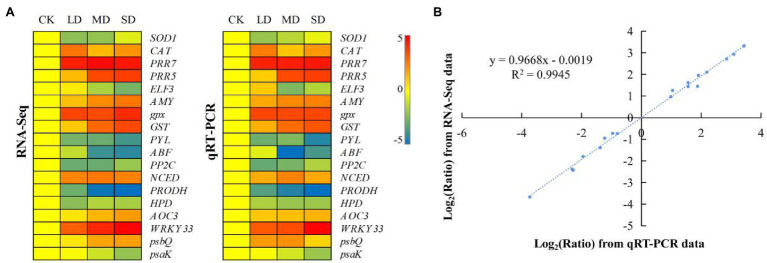
Figure 5.
Expression patterns of 18 selected genes identified by RNA-seq were verified via quantitative real-time (qRT) PCR. (A) Heatmap showing the expression changes [log2(fold-change [FC])] in response to the CK to SD treatments for each candidate gene, as measured by RNA sequencing (RNA-seq) and qRT–PCR. (B) Scatter plot showing the changes in the expression [log2(FC)] of selected genes based on RNA-seq via qRT–PCR. The gene expression levels are indicated by coloured bars.

