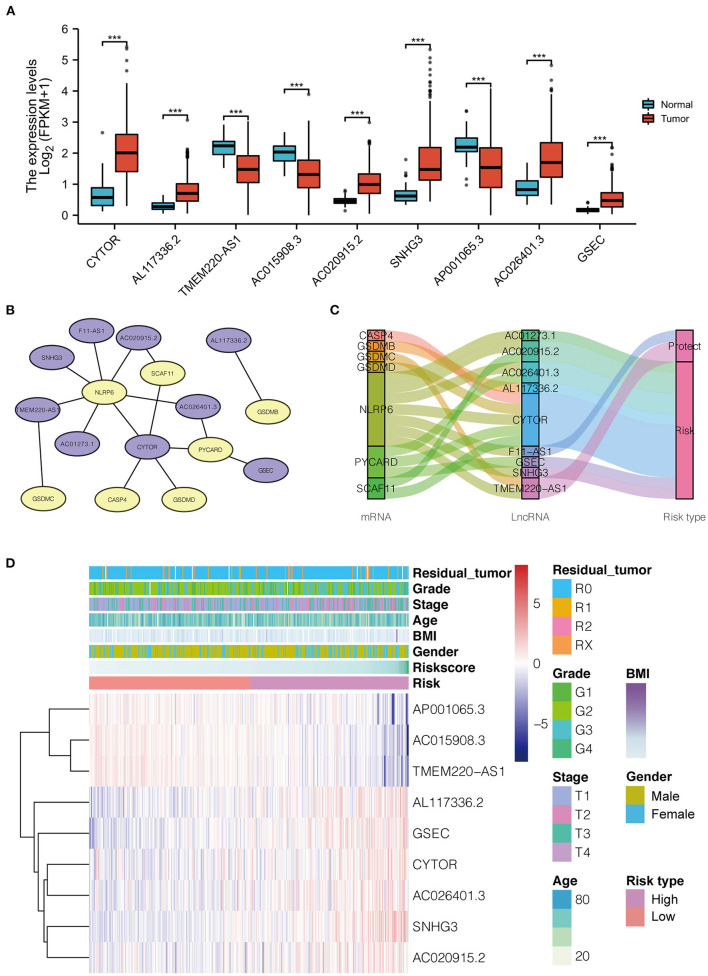
Figure 2.
(A) The distribution of 9 pyroptosis-related lncRNA expression patterns in tumor and adjacent normal liver tissues based on LIHC-TCGA dataset. (B) The co-expression network of the 9 pyroptosis-related lncRNAs-mRNAs with prognostic value was constructed and visualized using Cytoscape (Purple represents lncRNA, and yellow represents mRNA). (C) Sankey diagram for pyroptosis-related lncRNAs-mRNAs co-expression network. (D) Heatmap for the expressions of 9 lncRNAs and clinicopathologic characters of the low- and high-risk groups. LICH, Liver hepatocellular carcinoma; TCGA, The Cancer Genome Atlas; BMI, Body Mass Index.

